AUDUSD Price Analysis: Bears pressure below 0.6750, 0.6650 and below eyed
- AUDUSD bears are lurking at a key area of resistance.
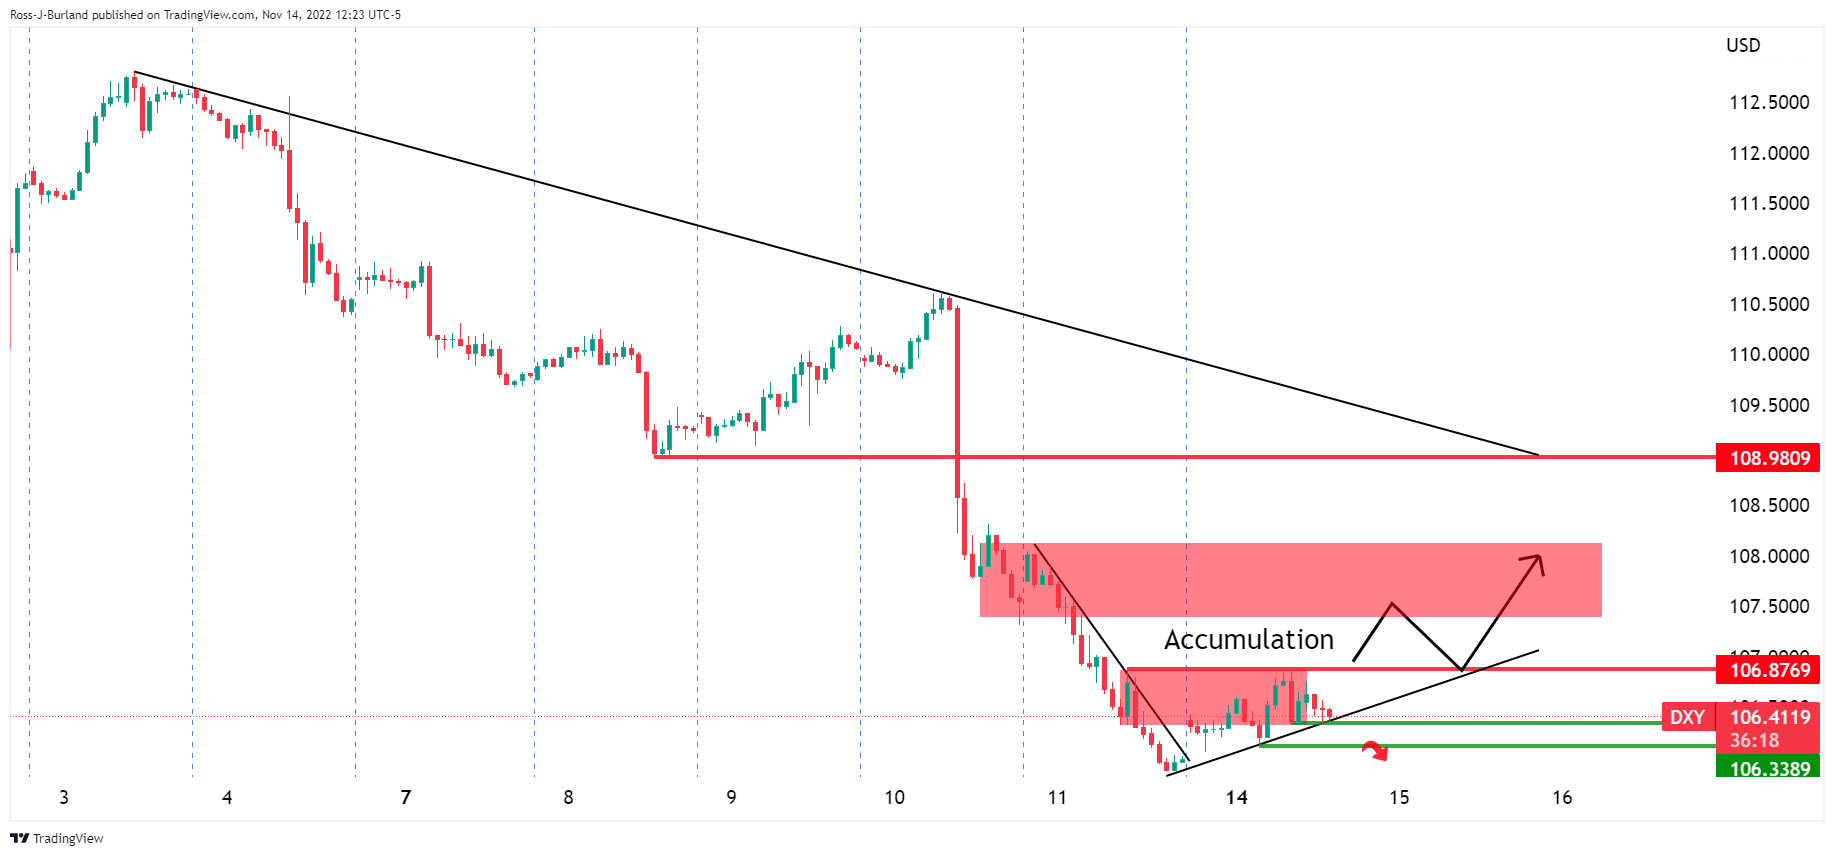
- US Dollar showing signs of accumulation in lower time frames.
As per the start of the week's pre-open analysis: AUDUSD Price Analysis: A deceleration opens risk of a break to 0.6650 and below, the price continues to decelerate on Monday.
So far, AUDUSD has stuck to a 0.6663 / 0.6716 range and is flat on the day so far:
AUDUSD H1 chart
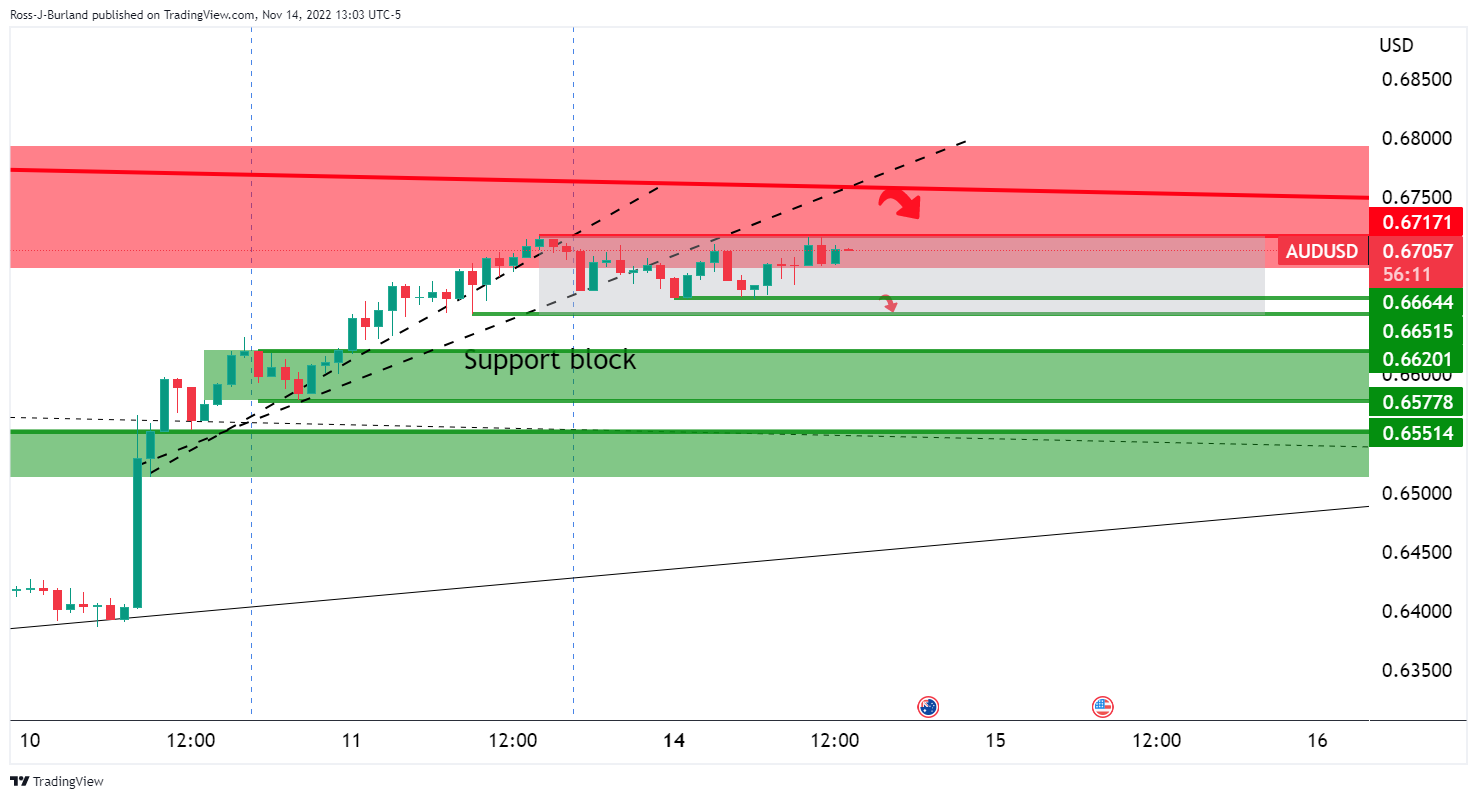
The bears are pressing below 0.6750 and 0.6700 is under pressure. A break of 0.6650/40 opens the risk of a significant bearish correction.
AUDUSD daily chart
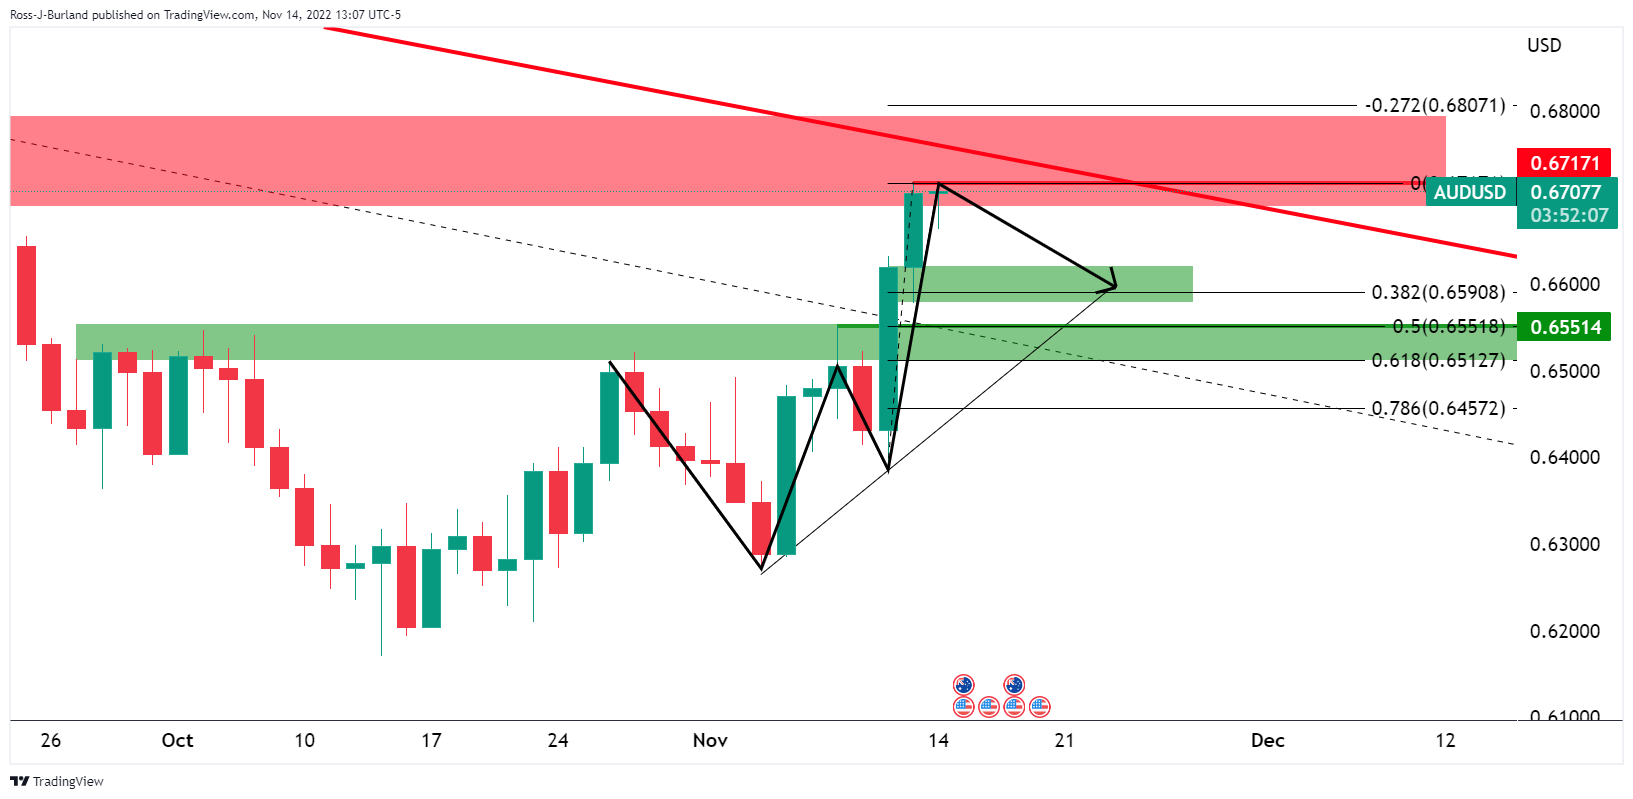
The daily chart's W-formation is a significant feature for the week ahead. This is a reversion pattern whereby the price would be expected to move into the neckline of the formation in due course. The Fibonacci scale has the 61.8% ratio aligned with the neckline on the way down below the first target as being the 38.2% Fibo below 0.66 the figure.
The trajectory will depend on the US Dollar which is currently showing all of the signs of accumulation on the hourly chart: