US Dollar Price Analysis: Bulls eye a run to test 102.80 structure
- US Dollar bulls are lurking above 101.50.
- Inverse Head and shoulders on the cards for a move to test 102.80 key resistance structure.
The US Dollar was pulled into a bearish correction on Tuesday after better-than-forecast growth data from China which is throwing the technicals into what could be a bullish chart pattern at the bottom of the micro bear trend:
US Dollar daily chart
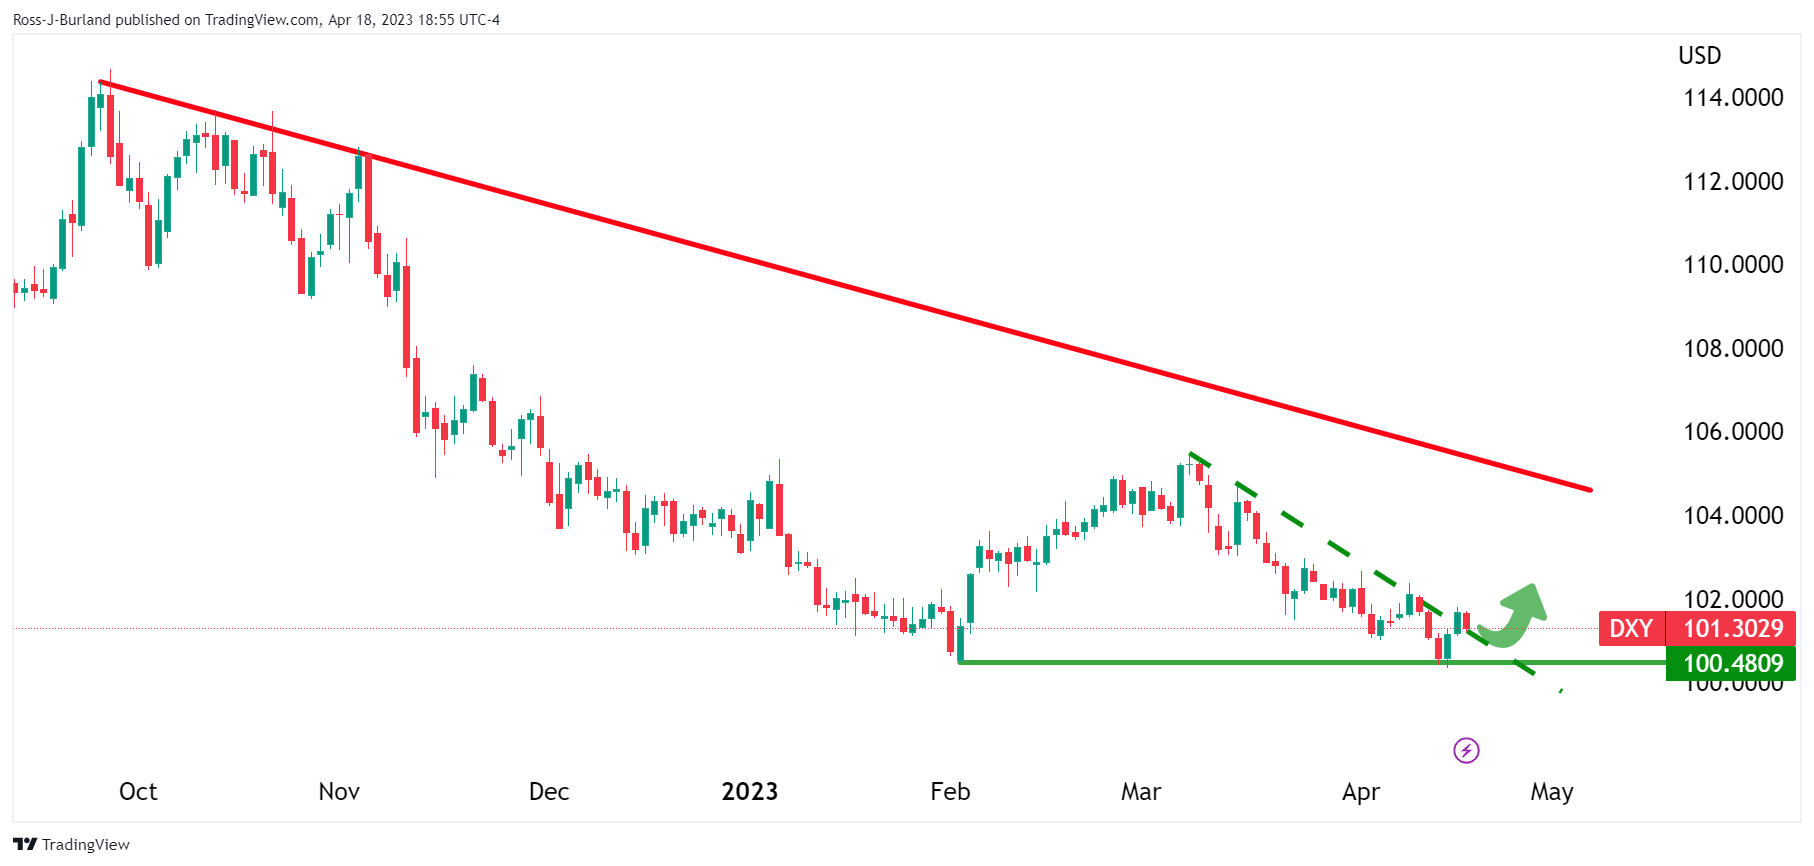
The bulls managed to pierce the trendline resistance but there has been no follow-through. However, a bullish schematic could be playing out in the form of an inverse head and shoulders:

US Dollar H4 charts
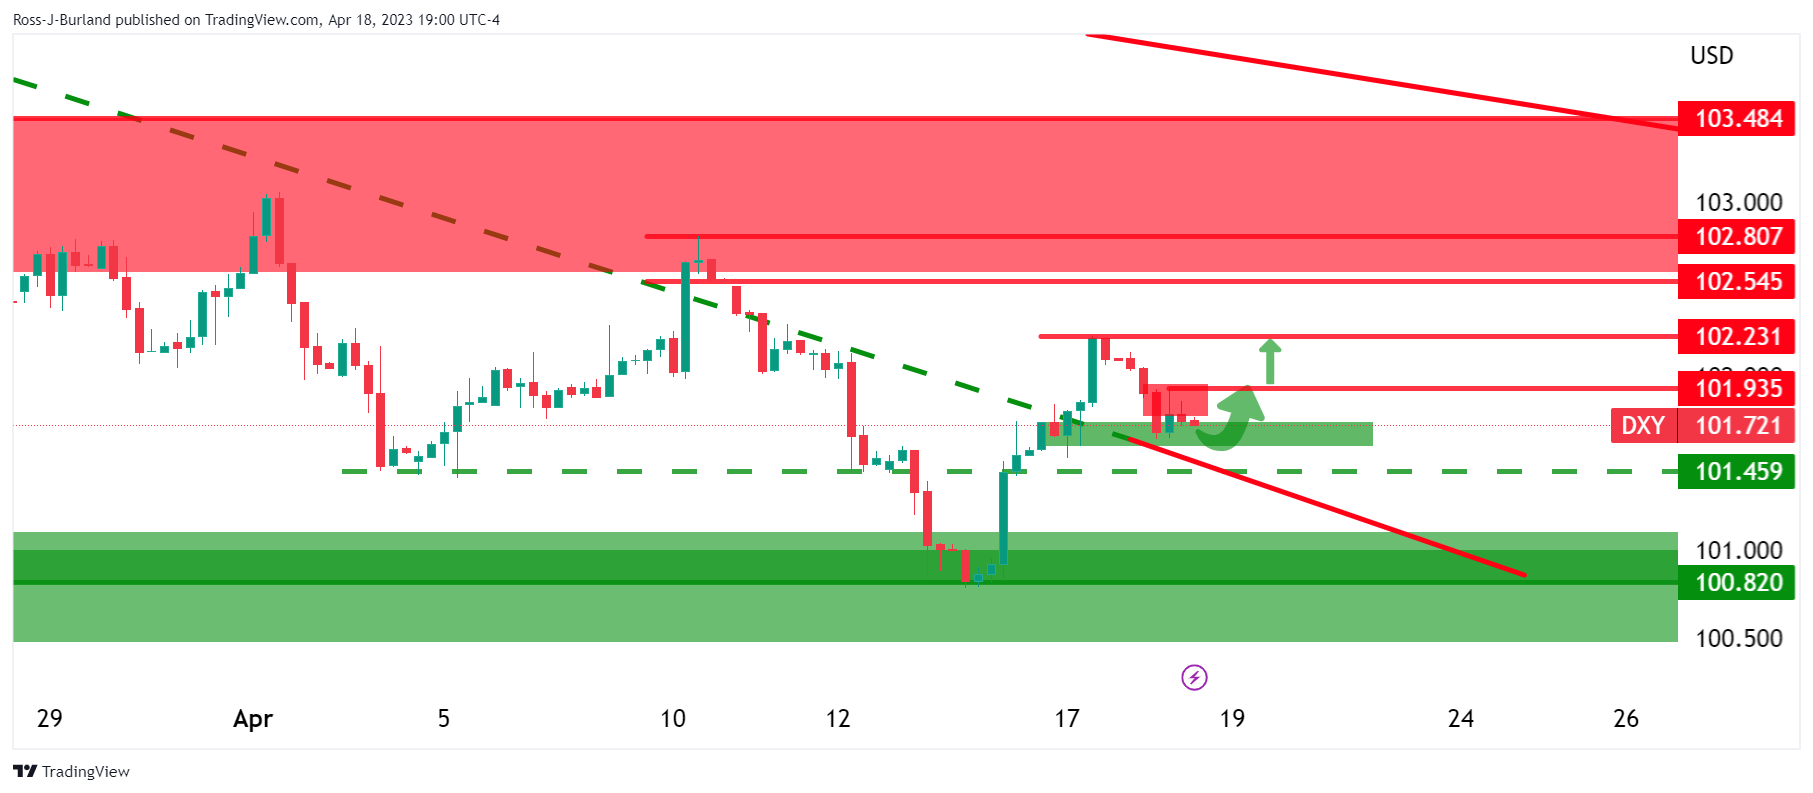
The bullish scenario could look something like the above as the bulls seek to move in on the 102.20s and then the key 102.80 structure while the bearish scenario, which is so far playing out, could look as follows:

The 101.50s will be key in this regard as this protects the countertrend. A break back onto the front side of the bearish trend would not only invalidate the inverse head and shoulders thesis, but it could subsequently lead to a significant downside continuation and a lower low if 100.80 is broken.