9 Nov 2023
USD Index Price Analysis: Immediate resistance emerges around 106.00
- DXY trades within a narrow range around 105.60 on Thursday.
- The continuation of the upside momentum should retest the 106.00 zone.
DXY alternates gains with losses around 105.60 on Thursday.
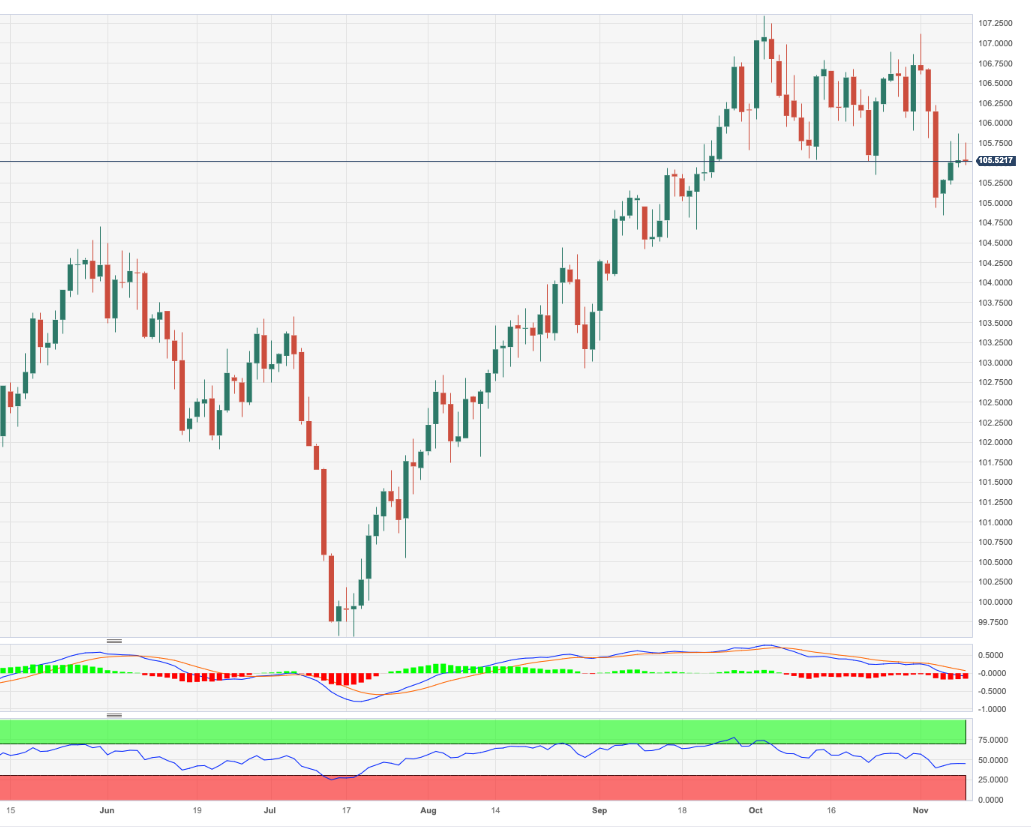
In case the buying interest gathers extra pace, the index should face the initial hurdle at the weekly high of 105.87 (November 8). The surpass of this level could open the door to a rapid visit to the November top at 107.11 (November 1) prior to the 2023 peak of 107.34 (October 3).
In the meantime, while above the key 200-day SMA, today at 103.57, the outlook for the index is expected to remain constructive.
DXY daily chart