GBP/USD Technical Analysis: Tests a descending trend-channel support ahead of US CPI
• Struggled to move back above 200-hour SMA and has now fallen to test a short-term descending trend-channel formation on the 1-hourly chart.
• With short-term technical indicators holding in negative territory, a modest rebound, following the release of updated Brexit white paper, might turn out to be short-lived.
• Stronger-than-expected US CPI print might trigger a fresh bout of selling and contribute towards confirming a near-term bearish breakdown.
GBP/USD 1-hourly chart
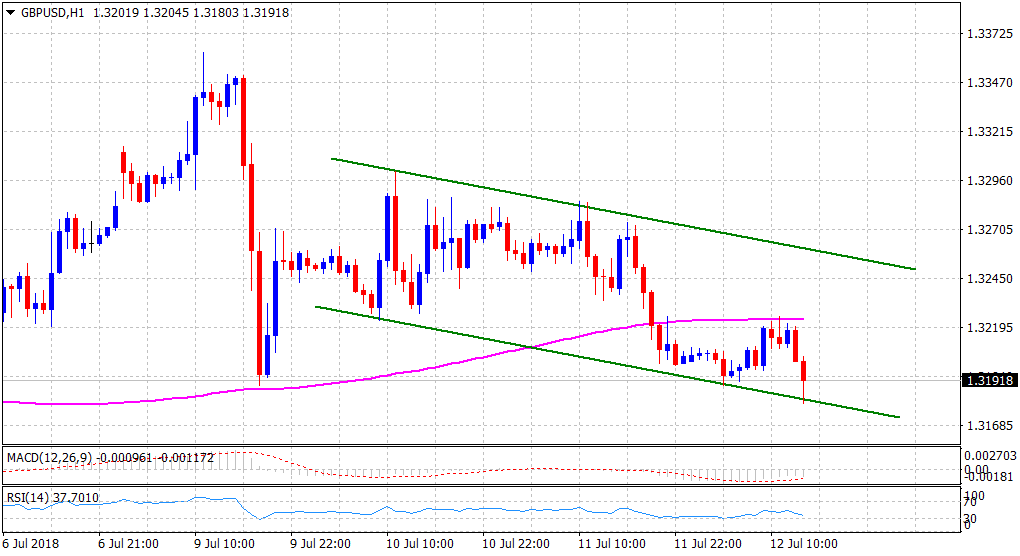
Spot rate: 1.3192
Daily High: 1.3226
Daily Low: 1.3180
Trend: Bearish below trend-channel support
Resistance
R1: 1.3226 (current day swing high)
R2: 1.3256 (100-period SMA H1)
R3: 1.3317 (R2 daily pivot-point)
Support
S1: 1.3180 (descending trend-channel)
S2: 1.3144 (S2 daily pivot-point)
S3: 1.3095 (July 2 swing low)