20 Aug 2018
USD/JPY Technical Analysis: USD bulls left in the cold - USD/JPY dropping towards 110.10 level
- USD/JPY main trend has paused since July, 19 as the market is in a triangle consolidation.
- USD/JPY is challenging last Friday’s low as the market has rejected the 50-daily simple moving average. Bears target is 110.10 August 13 swing low and the trendline.
- A bull breakout above 111.45 swing high would negate the short-term bearish bias.
USD/JPY daily chart
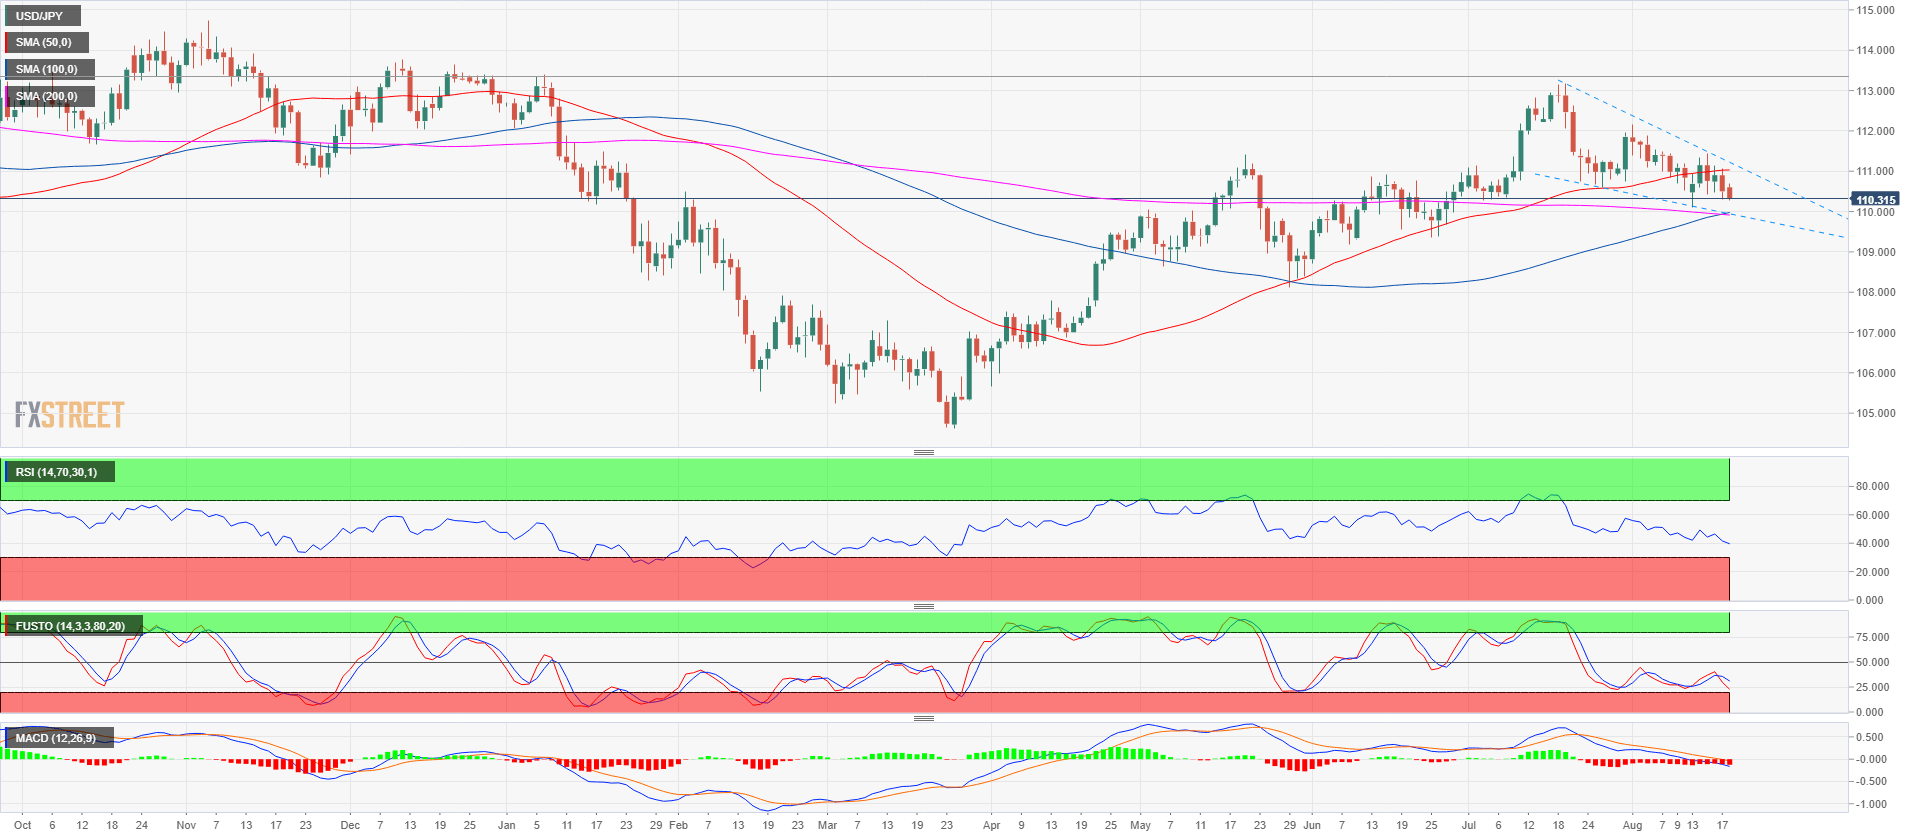
Spot rate: 110.31
Relative change: -0.17%
High: 110.70
Low: 110.26
Main trend: Bullish
Short-term trend Bearish below 110.45
Resistance 1: 110.40 demand level
Resistance 2: 110.58 July 26 swing low
Resistance 3: 110.75, July 23 low
Resistance 4: 110.90 June 15 swing high
Resistance 5: 111.02-111.16 area, figure and current August 6 low
Resistance 6: 111.45 August 8 high
Resistance 7: 111.54-111.64 area, August 6, high and supply/demand level
Support 1: 110.10 August 13 swing low
Support 2: 109.37 June 25 swing low
Support 3: 109.19 June 8 low