21 Aug 2018
GBP/USD Technical Analysis: King Dollar getting pounded as Cable is blasting towards 1.2960 key target
- GBP/USD main bear trend is on hold for the fifth consecutive day as GBP/USD is having a strong bullish pullback.
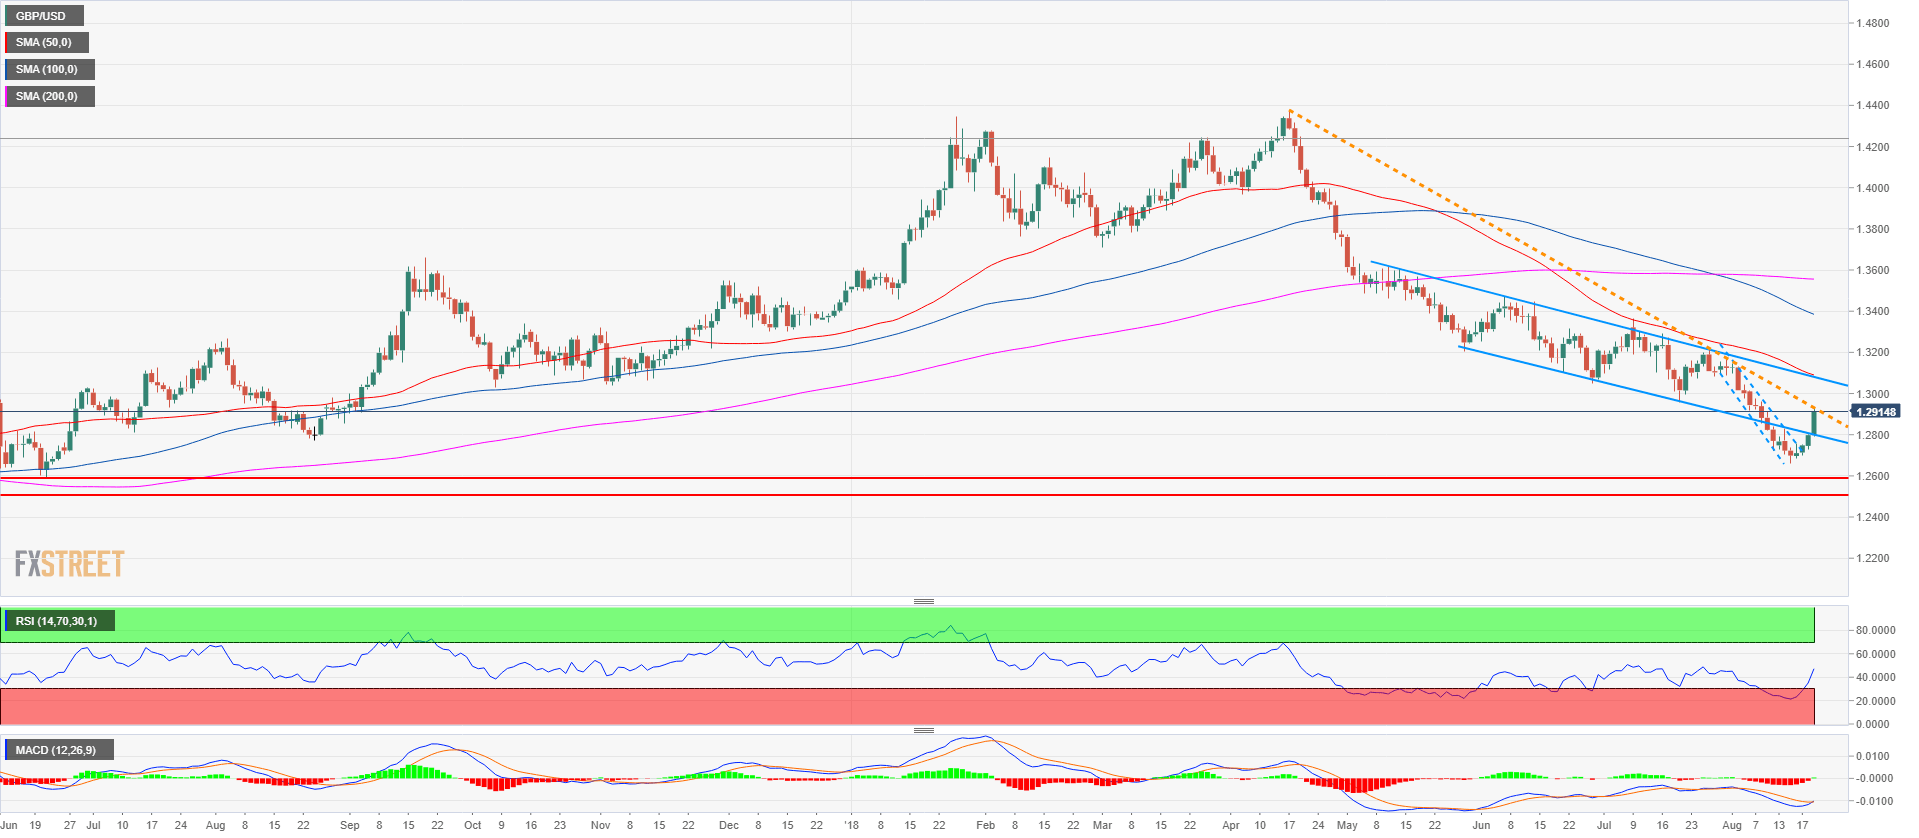
- The GBP/USD strength in the last five days has been extremely strong as the market is breaking above every conceivable trendlines. If bulls can reach 1.2957 key resistance, traders must open up to the possibility that the pullback might be transitioning into a bullish reversal (seen on daily time frame). Bulls are also challenging a descending trendline on the daily time-frame, a break above it would be another clue that the bear trend might start to be at risk.
- A sustained bear breakout below 1.2800 would invalidate the bullish bias.
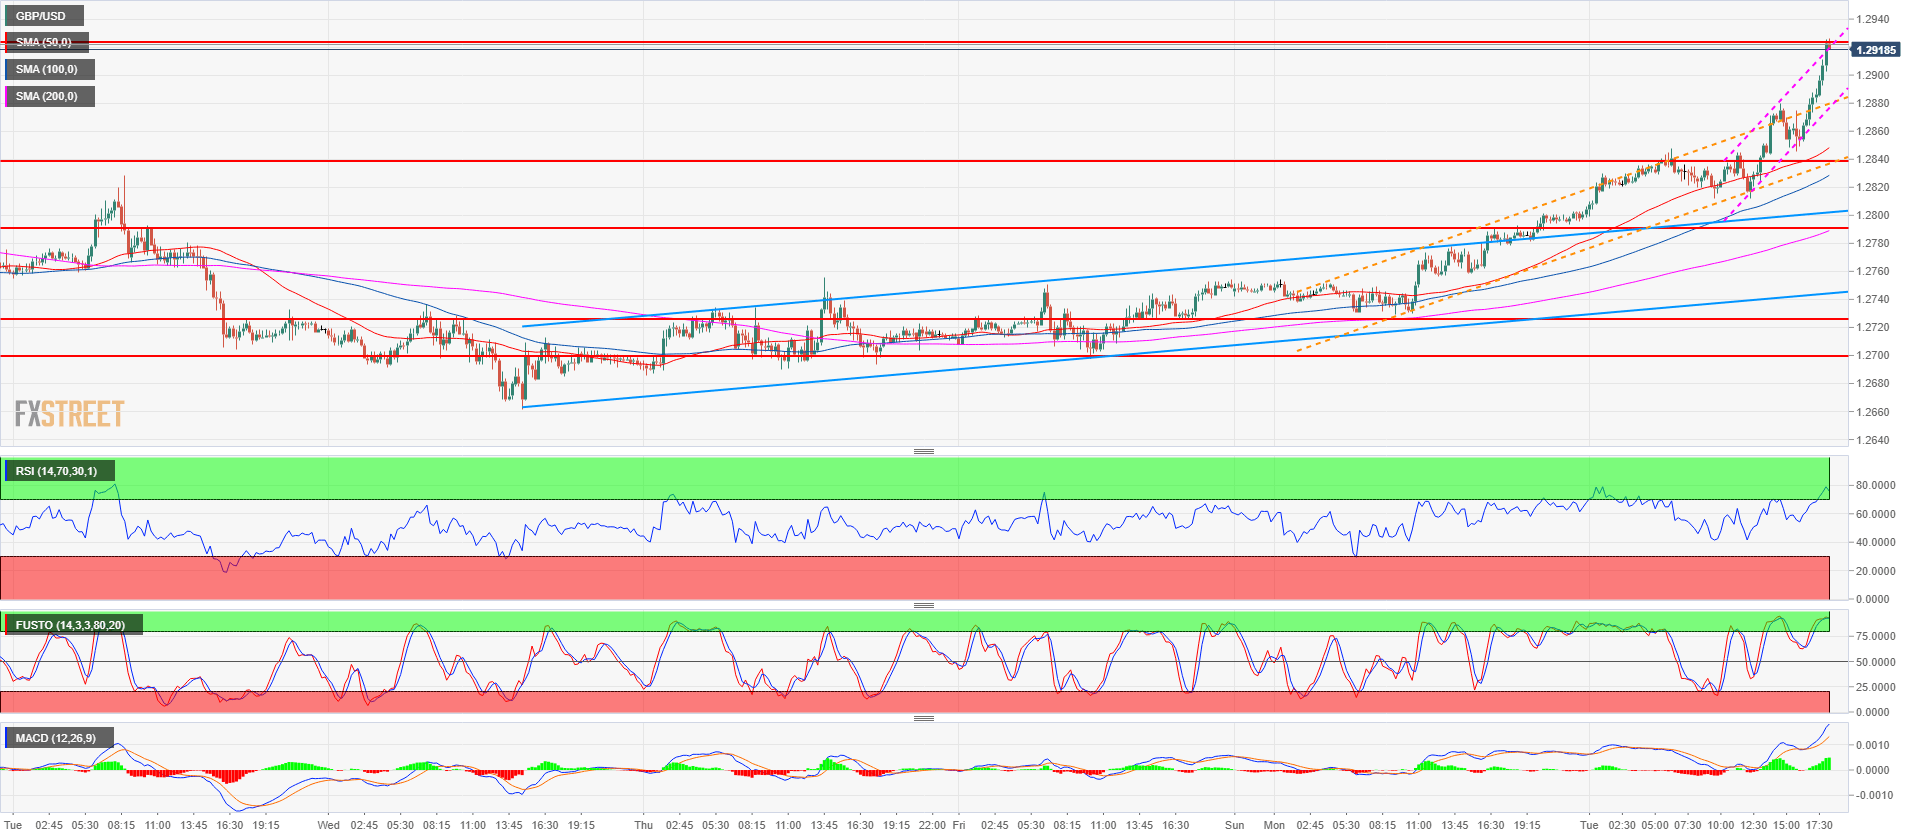
GBP/USD 15-minute chart
GBP/USD daily chart
Spot rate: 1.2914
Relative change: 0.91%
High: 1.2926
Low: 1.2793
Trend: Bearish
Short-term trend: Bullish above 1.2800
Resistance 1: 1.2900-1.2923 area, figure and August 7 low
Resistance 2: 1.2957 July 19 low
Resistance 3: 1.3000 figure
Support 1: 1.2838, August 10 high
Support 2: 1.2789-1.2800 area, intraday swing high and figure
Support 3: 1.2723, August 10 low
Support 4: 1.2700 figure