Gold Technical Analysis: 3-week old tight trading can lead to explosive breakout
- Gold main bear trend has switched to a sideways consolidation.
- Since early September, Gold is trading in a narrow $20 range between 1,190.00 and $1,210.00 a troy ounce while the 50, 100 and 200-period simple moving averages are coiled together.
- The market has lost its directional bias and a strong breakout in either direction is likely going to set the tone and the trend for the coming weeks.
Gold 4-hour chart
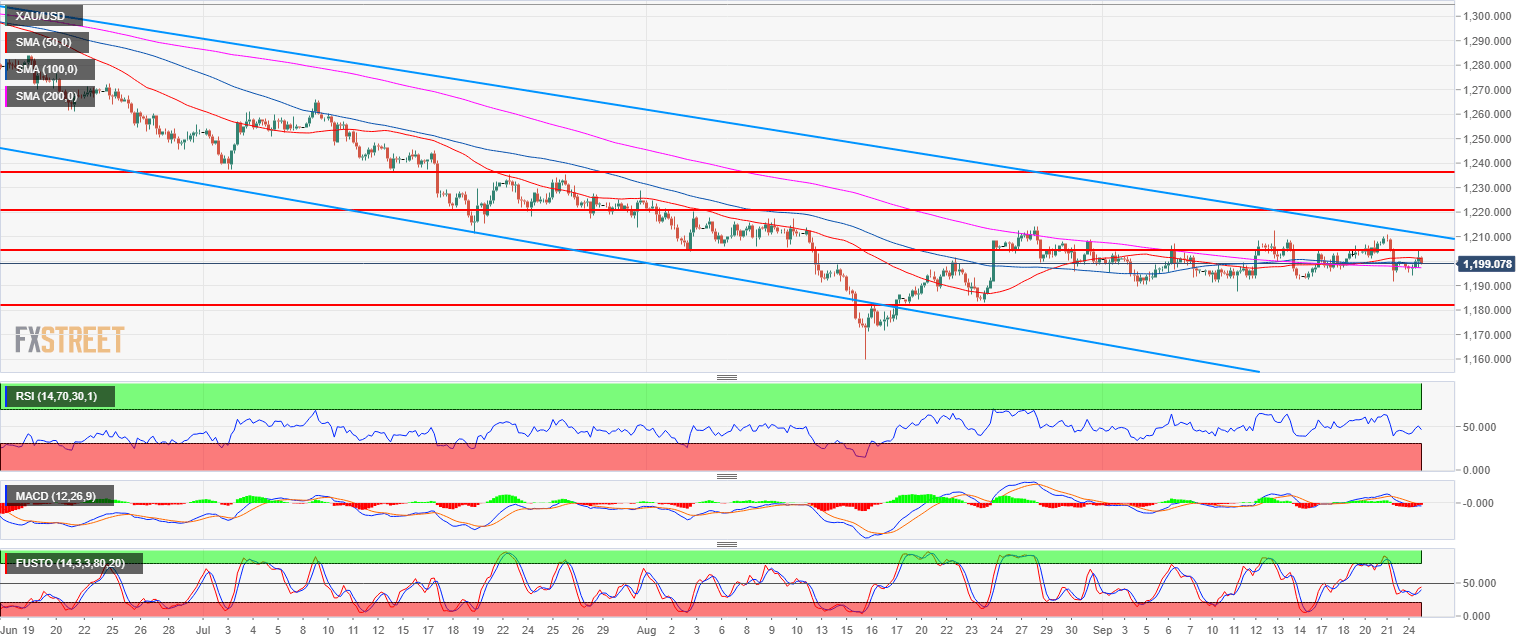
Spot rate: 1,198.00
Relative change: -0.03%
High: 1,204.20
Low: 1,194.10
Main trend: Bearish
Short-term trend: Neutral
Resistance 1: 1,204.10, August 3 swing low (key level)
Resistance 2: 1,211.17 July 19 low
Resistance 3: 1,214.30 August 28 high
Resistance 4: 1,217.89-1,220.90 zone, August 6 high and July 18 low
Resistance 5: 1,225.90 July 17 low
Resistance 6: 1,237.60 July 3 swing low
Support 1: 1,194.30 March 10, 2017 low
Support 2: 1,189.49 September 4 low
Support 3: 1,172.82 current 2018 low
Support 4: 1,145.20 March, 1 2017 low