18 Oct 2018
Gold Technical Analysis: Yellow Metal consolidating in a bull flag just below 1,230.00 level
- Gold is trading in a bull trend above the 200-period simple moving average.
- The metal is consolidating in a bull flag as bulls are trying to break above the 1,230.00 level.
- A bear breakout below 1,115.00 on a daily closing basis would likely be a warning sign for bulls.
Gold 4-hour chart
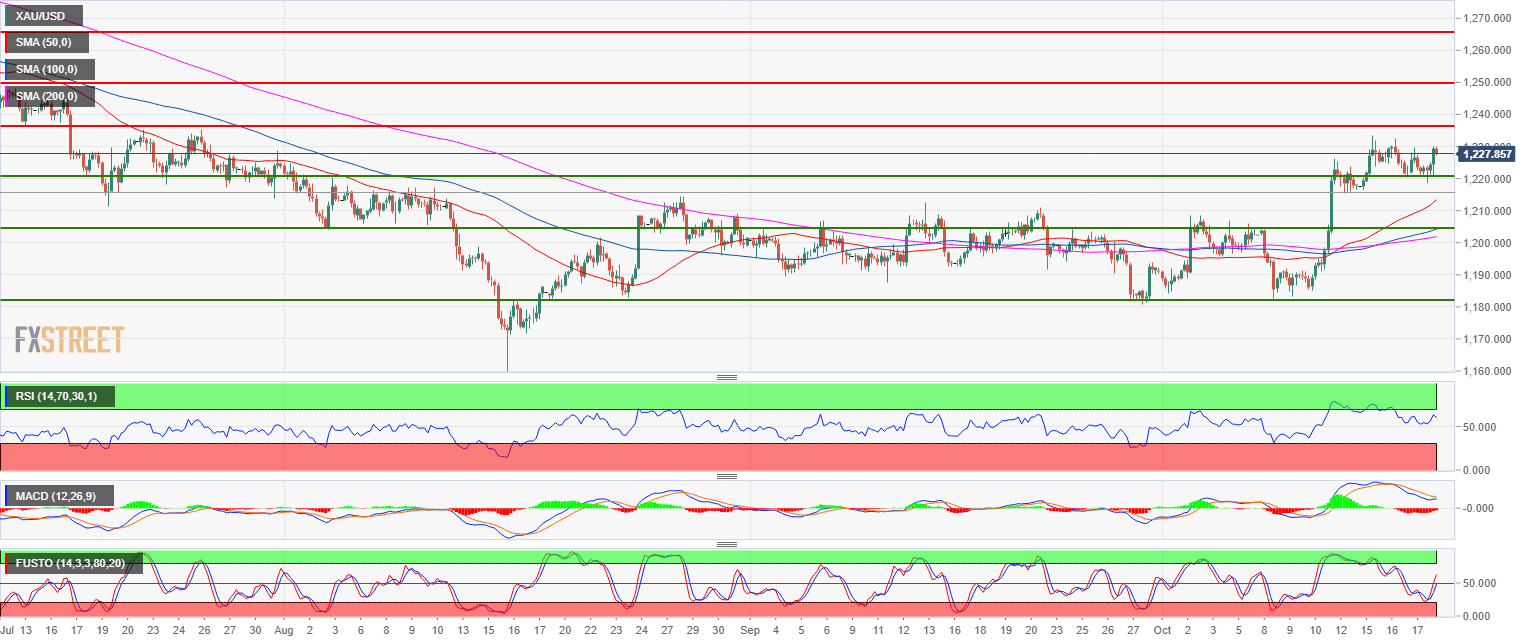
Rate: 1,227.87
Relative change: 0.45%
High: 1,230.14
Low: 1,218.40
Main trend: Bullish
Resistance 1: 1,237.60 July 3 swing low
Resistance 2: 1,250.00 figure
Resistance 3: 1,265.90 July high
Support 1: 1,220.90 July 18 low
Support 2: 1,211.17 July 19 low
Support 3: 1,204.10, August 3 swing low (key level)
Support 4: 1,182.90 August 24 low
Support 5: 1,172.82 current 2018 low