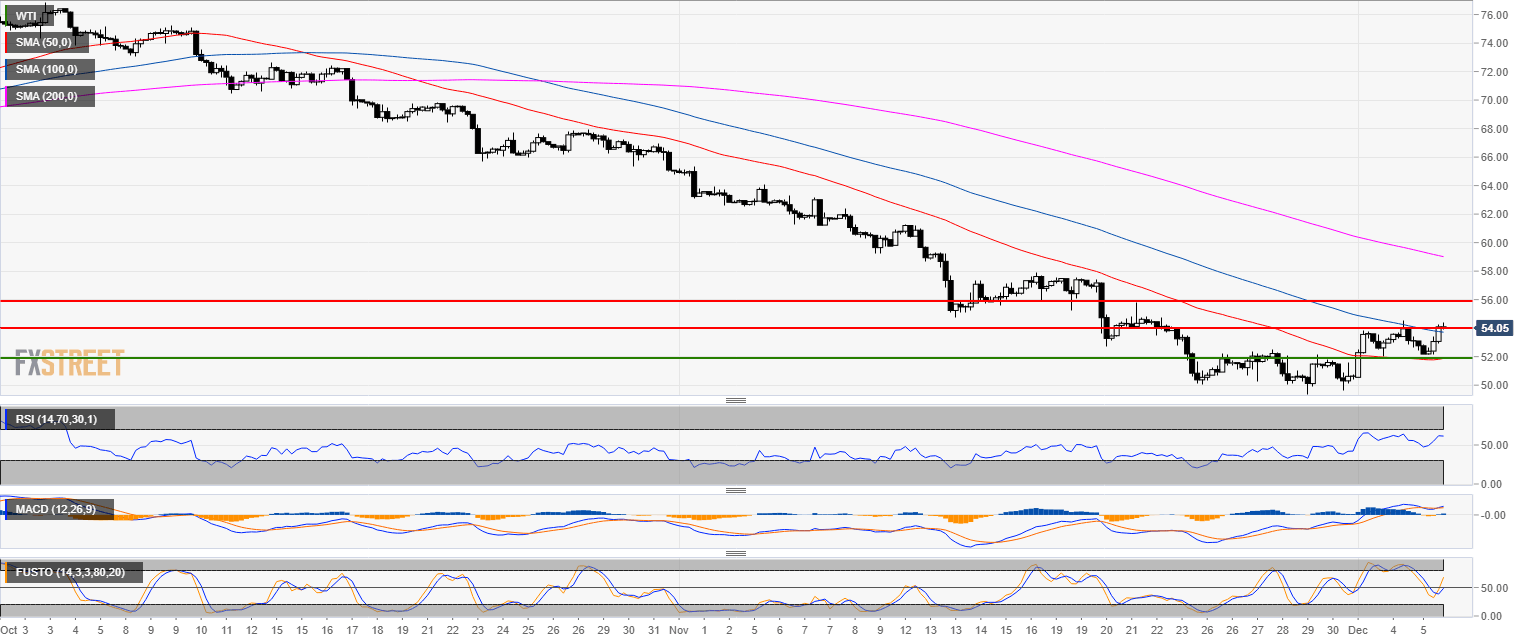
Oil Technical Analysis: Black Gold challenging $54.00 a barrel
Oil 4-hour chart
- Bulls took the 50 and 100 SMA as they are trading at monthly and weekly highs.
- Technical indicators are currently bullish suggesting further upside.
- The bulls objective is to reach the 56.00 level.
Additional key levels
WTI
Overview:
Today Last Price: 54.11
Today Daily change: 1.4e+2 pips
Today Daily change %: 2.56%
Today Daily Open: 52.76
Trends:
Previous Daily SMA20: 53.8
Previous Daily SMA50: 61.86
Previous Daily SMA100: 65.78
Previous Daily SMA200: 67.38
Levels:
Previous Daily High: 52.8
Previous Daily Low: 52.61
Previous Weekly High: 52.13
Previous Weekly Low: 49.64
Previous Monthly High: 63.92
Previous Monthly Low: 49.64
Previous Daily Fibonacci 38.2%: 52.73
Previous Daily Fibonacci 61.8%: 52.68
Previous Daily Pivot Point S1: 52.65
Previous Daily Pivot Point S2: 52.53
Previous Daily Pivot Point S3: 52.46
Previous Daily Pivot Point R1: 52.84
Previous Daily Pivot Point R2: 52.91
Previous Daily Pivot Point R3: 53.03