
Gold Technical Analysis: Yellow Metal is under pressure below the 1,290.00 level
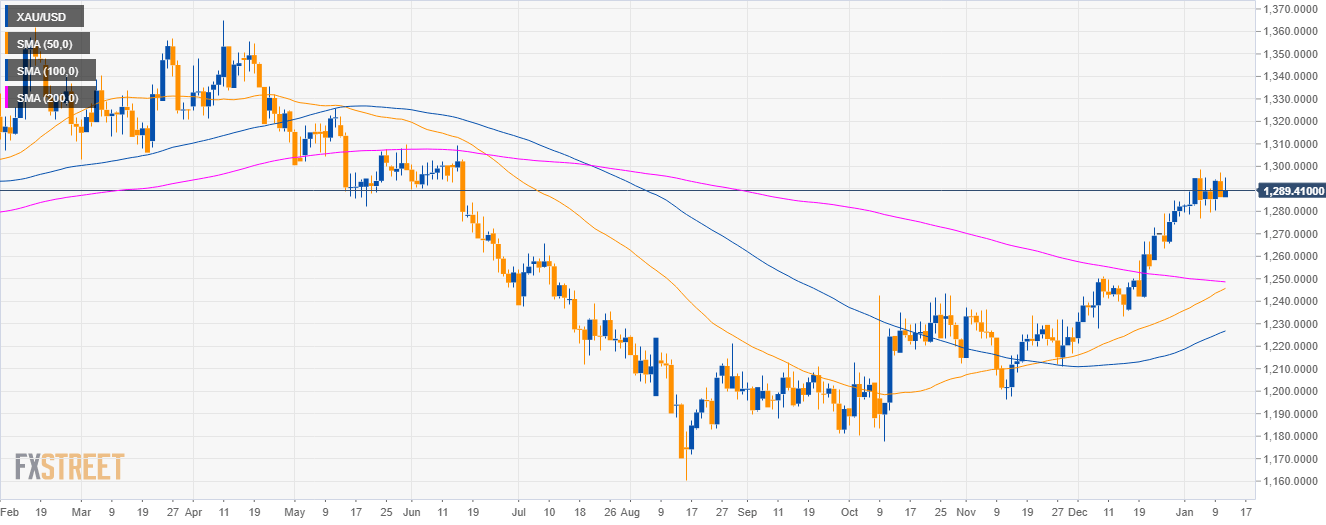
Gold daily chart
- Gold is trading in a bull trend above the 200-period simple moving average (SMA).
Gold 4-hour chart
- Gold is trading above its main SMAs while it is testing the 50 SMA.
- Gold is trading just below the 1,290.00 level.

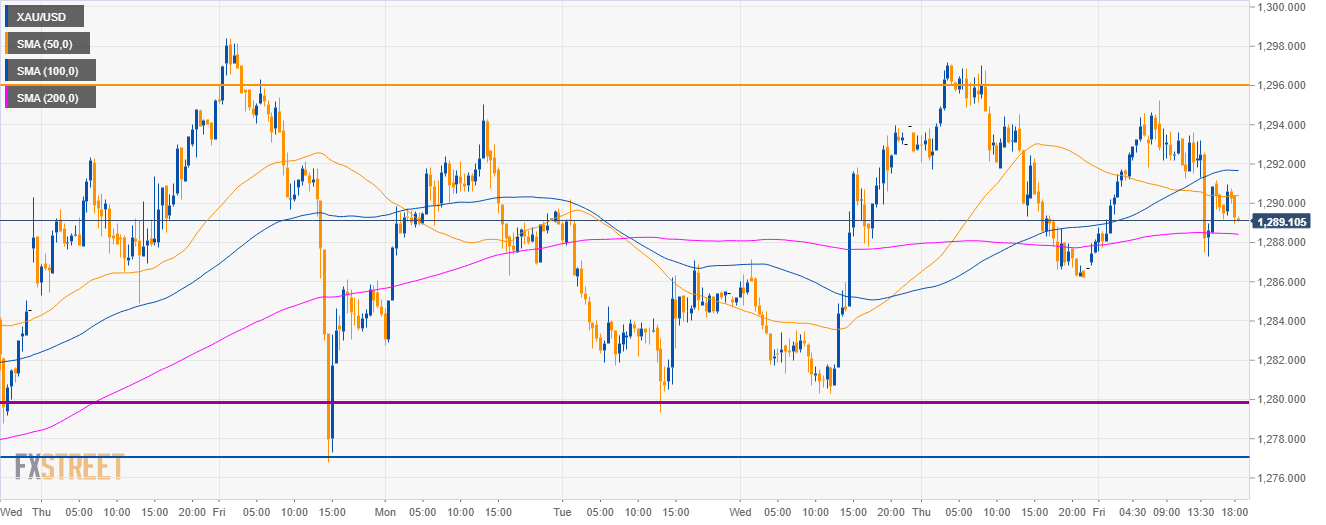
Gold 30-minute chart
- Gold bears would need to break below the 200 SMA to open the doors to the 1,280.00 level to the downside.
Additional key levels
XAU/USD
Overview:
Today Last Price: 1289.26
Today Daily change: 3.0e+2 pips
Today Daily change %: 0.230%
Today Daily Open: 1286.3
Trends:
Previous Daily SMA20: 1271.77
Previous Daily SMA50: 1243.49
Previous Daily SMA100: 1227.63
Previous Daily SMA200: 1229.07
Levels:
Previous Daily High: 1297.15
Previous Daily Low: 1286.25
Previous Weekly High: 1298.42
Previous Weekly Low: 1276.82
Previous Monthly High: 1284.7
Previous Monthly Low: 1221.39
Previous Daily Fibonacci 38.2%: 1290.41
Previous Daily Fibonacci 61.8%: 1292.99
Previous Daily Pivot Point S1: 1282.65
Previous Daily Pivot Point S2: 1279
Previous Daily Pivot Point S3: 1271.75
Previous Daily Pivot Point R1: 1293.55
Previous Daily Pivot Point R2: 1300.8
Previous Daily Pivot Point R3: 1304.45