14 Mar 2019
EUR/JPY Technical Analysis: The cross is flirting with the 100-day SMA near 126.60
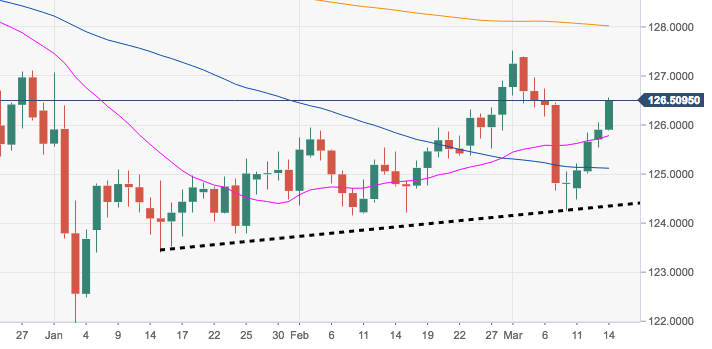
- The persistent weakness around the Japanese safe haven gives extra wings to the cross and pushes it to fresh tops near the 126.60 region, coincident with the 100-day SMA.
- The continuation of the upside impulse is expected to lift EUR/JPY to the area of 2019 highs further north of 127.00 the figure.
- Looking at the broader picture, the upside in the cross appears propped up by the short-term support line at 124.33.
EUR/JPY daily chart
EUR/JPY
Overview:
Today Last Price: 126.52
Today Daily change: 67 pips
Today Daily change %: 0.49%
Today Daily Open: 125.9
Trends:
Daily SMA20: 125.75
Daily SMA50: 125.07
Daily SMA100: 126.56
Daily SMA200: 128.04
Levels:
Previous Daily High: 126.06
Previous Daily Low: 125.54
Previous Weekly High: 127.4
Previous Weekly Low: 124.26
Previous Monthly High: 126.92
Previous Monthly Low: 124.16
Daily Fibonacci 38.2%: 125.86
Daily Fibonacci 61.8%: 125.74
Daily Pivot Point S1: 125.61
Daily Pivot Point S2: 125.32
Daily Pivot Point S3: 125.1
Daily Pivot Point R1: 126.13
Daily Pivot Point R2: 126.35
Daily Pivot Point R3: 126.64