26 Mar 2019
US Dollar Index Technical Analysis: Extra gains expected above recent highs around 96.80
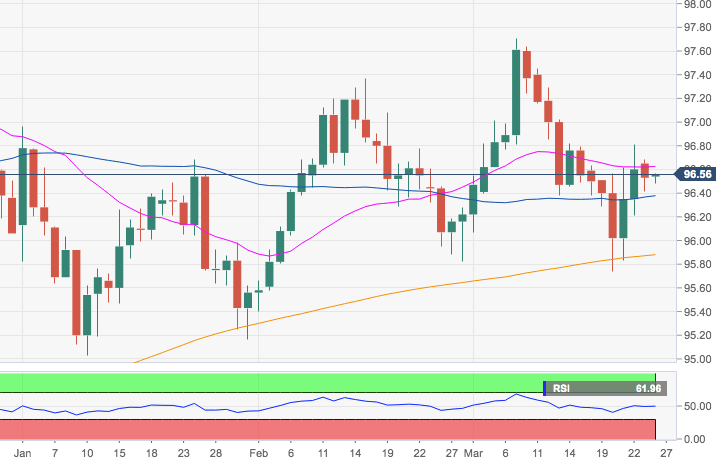
- DXY is now trading within a sideline theme around the 21-day and 100-day SMAs in the 96.50/60 band.
- The greenback needs to overcome last week’s tops at 96.80 to allow for further upside to, initially, February high at 97.37.
- Looking at the broader picture, the constructive bias remains unchanged while above the key 200-day SMA at 95.87. This area of support is reinforced by March 20 low at 95.74.
DXY daily chart