26 Mar 2019
Gold Technical Analysis: Bullish while above 50% Fibo; Break of trend-line resistance opens 1332 target
- The price took a dip below 1316/17, but found support at the next key level being the confluence of recent lows and the 50% Fibo.
- As can be seen, the eclipse is a key area that bulls need to remain within and the new trend line resistance will give way for a run to the 78.6% Fibo within the rising channel formation.
- 1323 ahead of 1332 guards the 2019 highs as being the 19th Feb high of 1345.19.
- On the downside, 1313 and 1302 are key. A break here will jeopardise the neutral/bullish Ichimoku Cloud and leave the outlook neutral with a bearish bias.
- 1298 and 1290 guard a run to 1280 as a keen target ahead of 1275 which remains the line in the sand to the downside.
- A break below here will put the attention back to the towards to 1250, a key confluence area made up of Fibos and prior support and resistance.
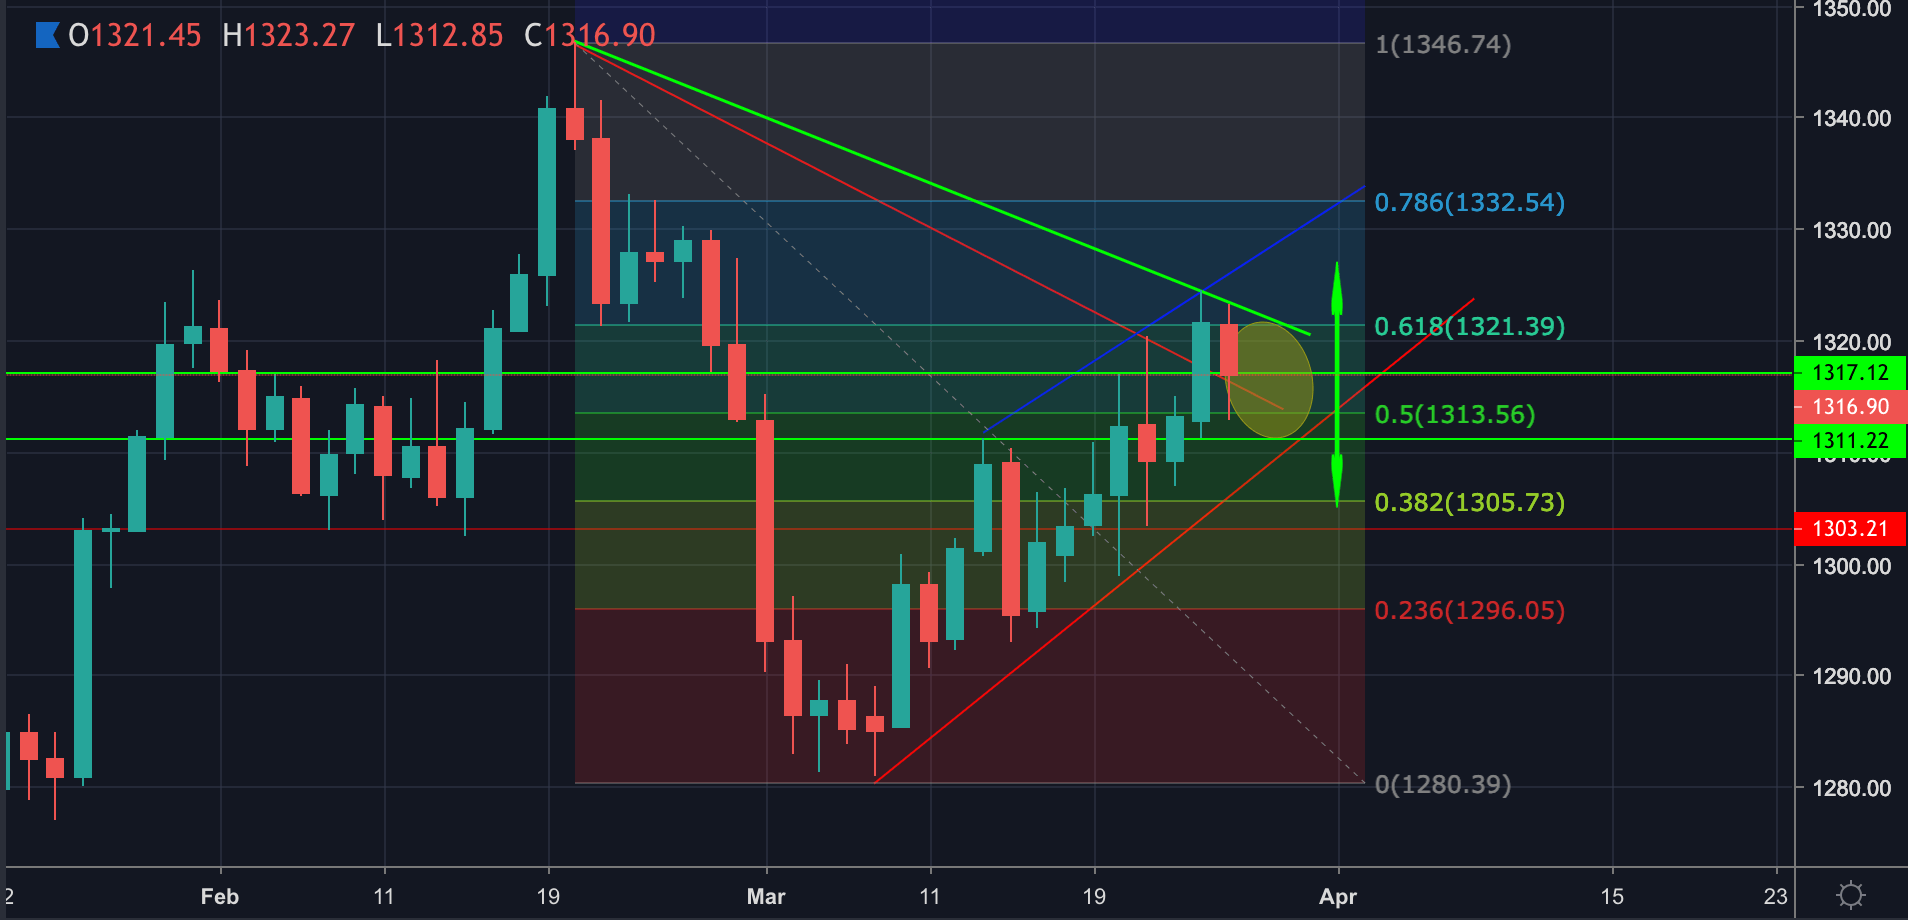
Gold daily chart