EUR/USD technical analysis: Scaling key descending trendline in Asia
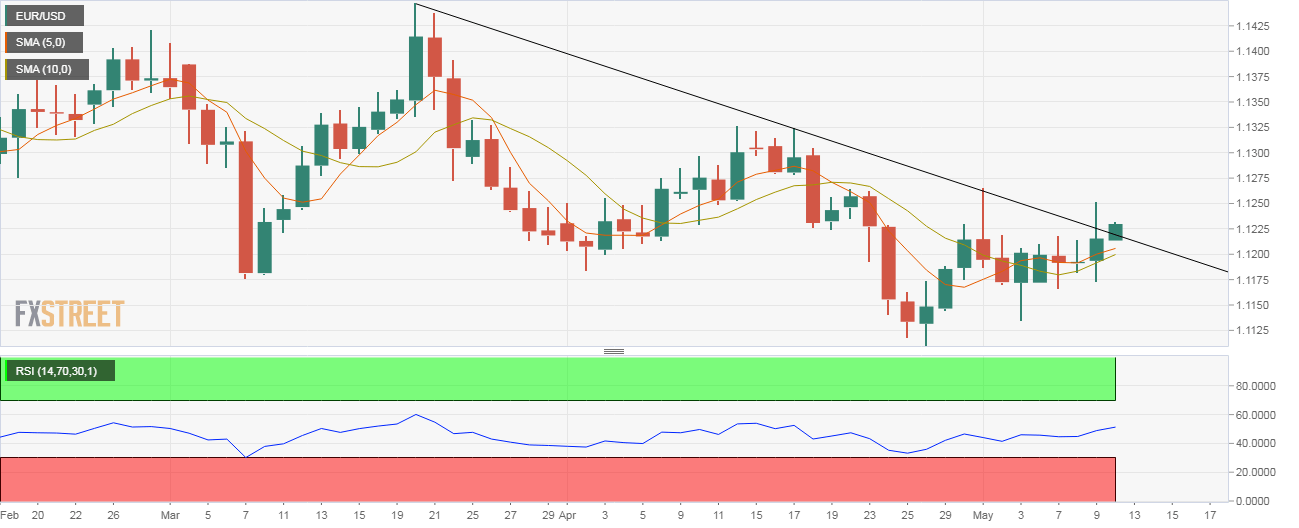
- EUR/USD is currently trading above the key falling trendline, which had reversed gains on May 1.
- A close above 1.1218 would confirm trendline breakout and open the doors to levels above 1.13.
EUR/USD has crossed the resistance of the trendline connecting March 20 and April 17 highs in Asia.
As of writing, the pair is trading at 1.1226 - just above the trendline hurdle of 1.1218.
That falling trendline had reversed rally on May 1. As a result, a break higher, if confirmed with a daily close above 1.1218, could invite strong buying pressure, yielding a retest of April highs above 1.1320. That looks likely as the 14-day relative strength index (RSI) is now hovering just above 50 with the 5- and 10-day moving averages (MAs) beginning to curl upwards.
The rise to 1.1320, however, may remain elusive if the 50-day moving average, currently at 1.1251, proves a tough nut to crack and ends up pushing the spot below the previous day's low of 1.1173.
Daily chart
Trend: Neutral
Pivot points