15 May 2019
US Dollar Index technical analysis: DXY gaining some ground above the 97.50 mark
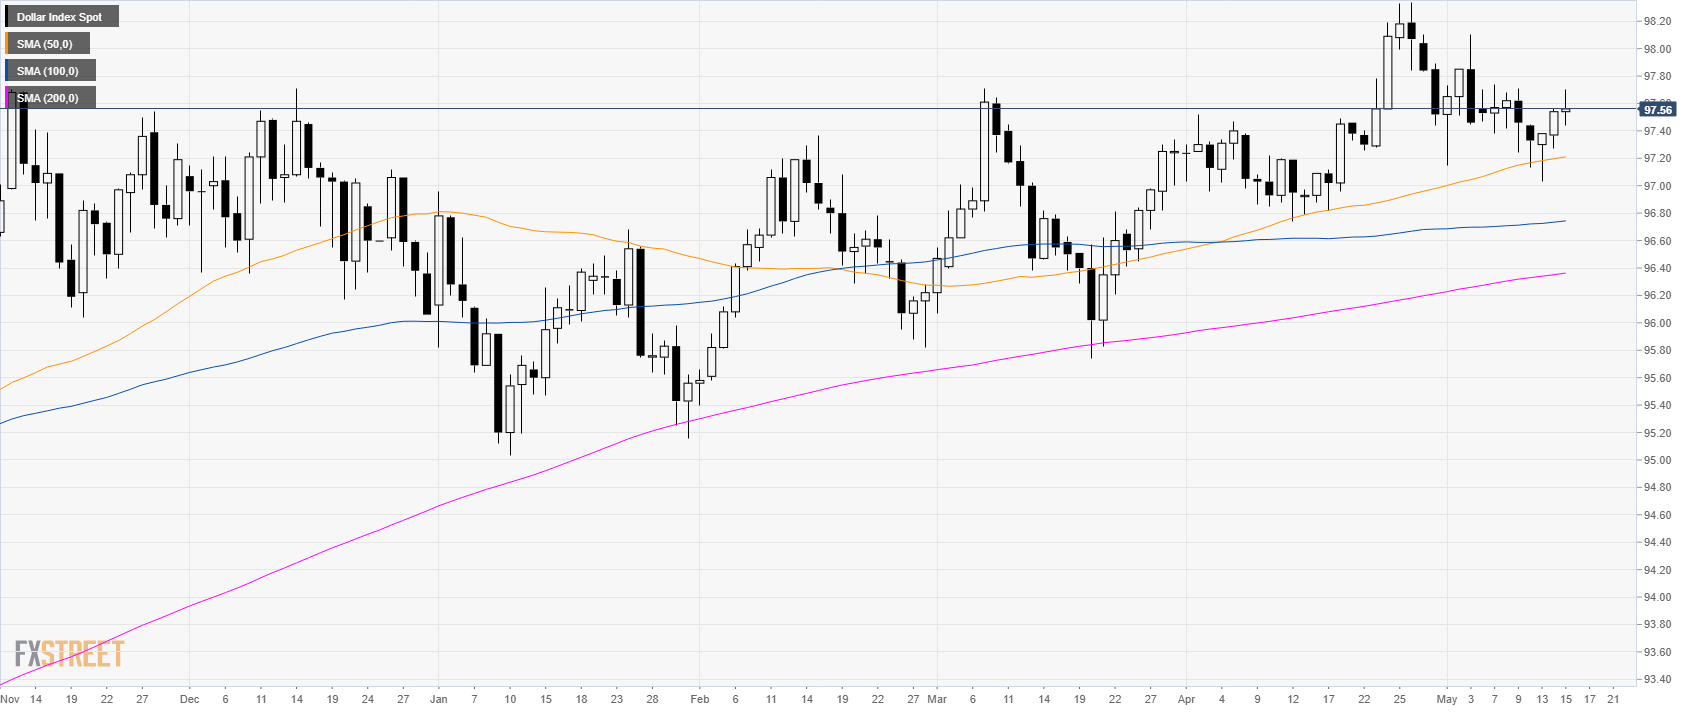
DXY daily chart
The US Dollar Index (DXY) is trading in a bull trend above its main simple moving averages (SMAs). The index reached 97.70 on Wednesday but gave back some of its gains on the back of comments from US President Trump. It has been reported that tariffs might be delayed on autos.
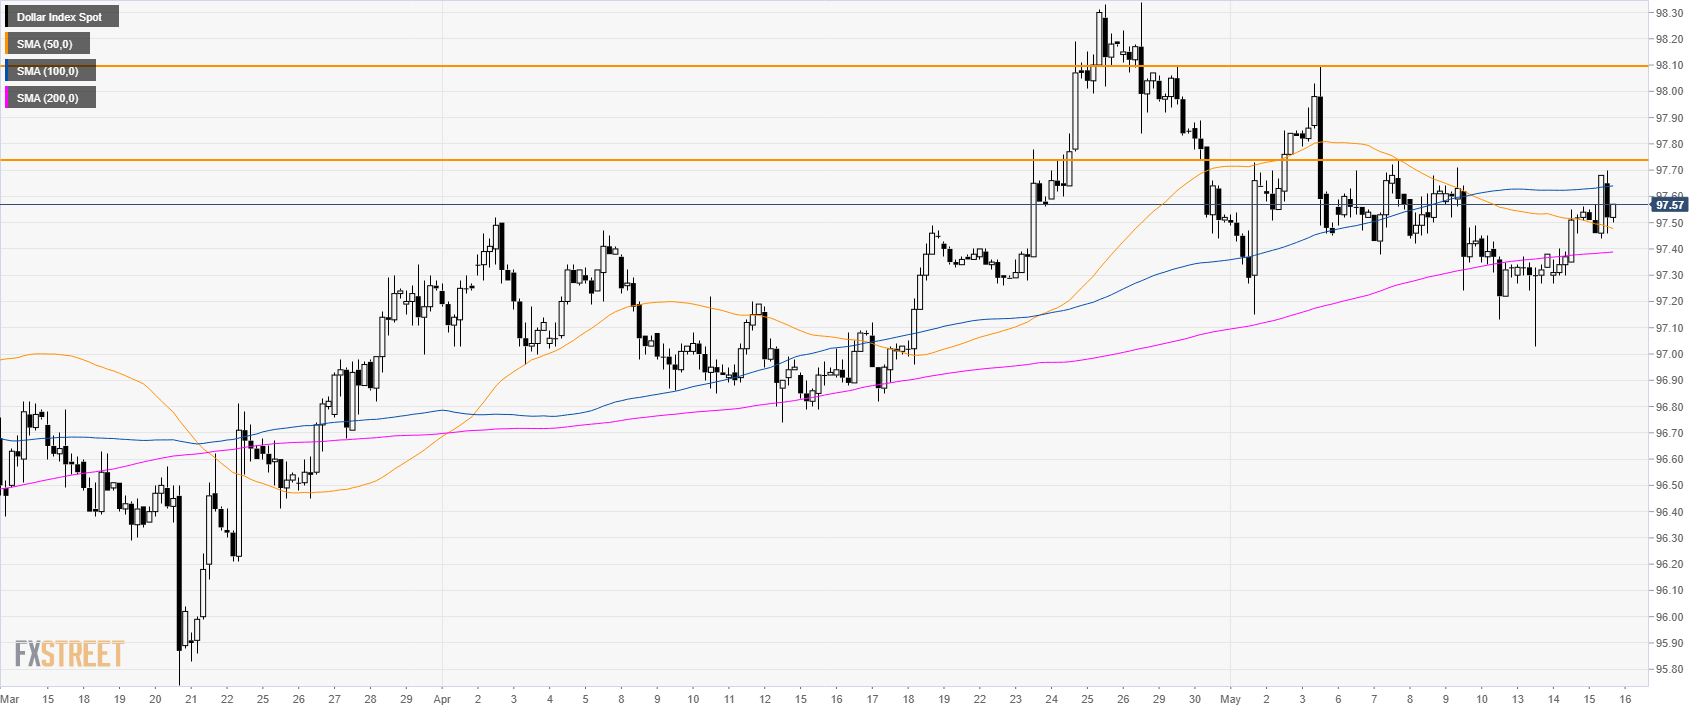
DXY 4-hour chart
The market is building its way up above the 50 and 200 SMAs. The 97.74 and 98.10 resistances remain potential targets to the upside.
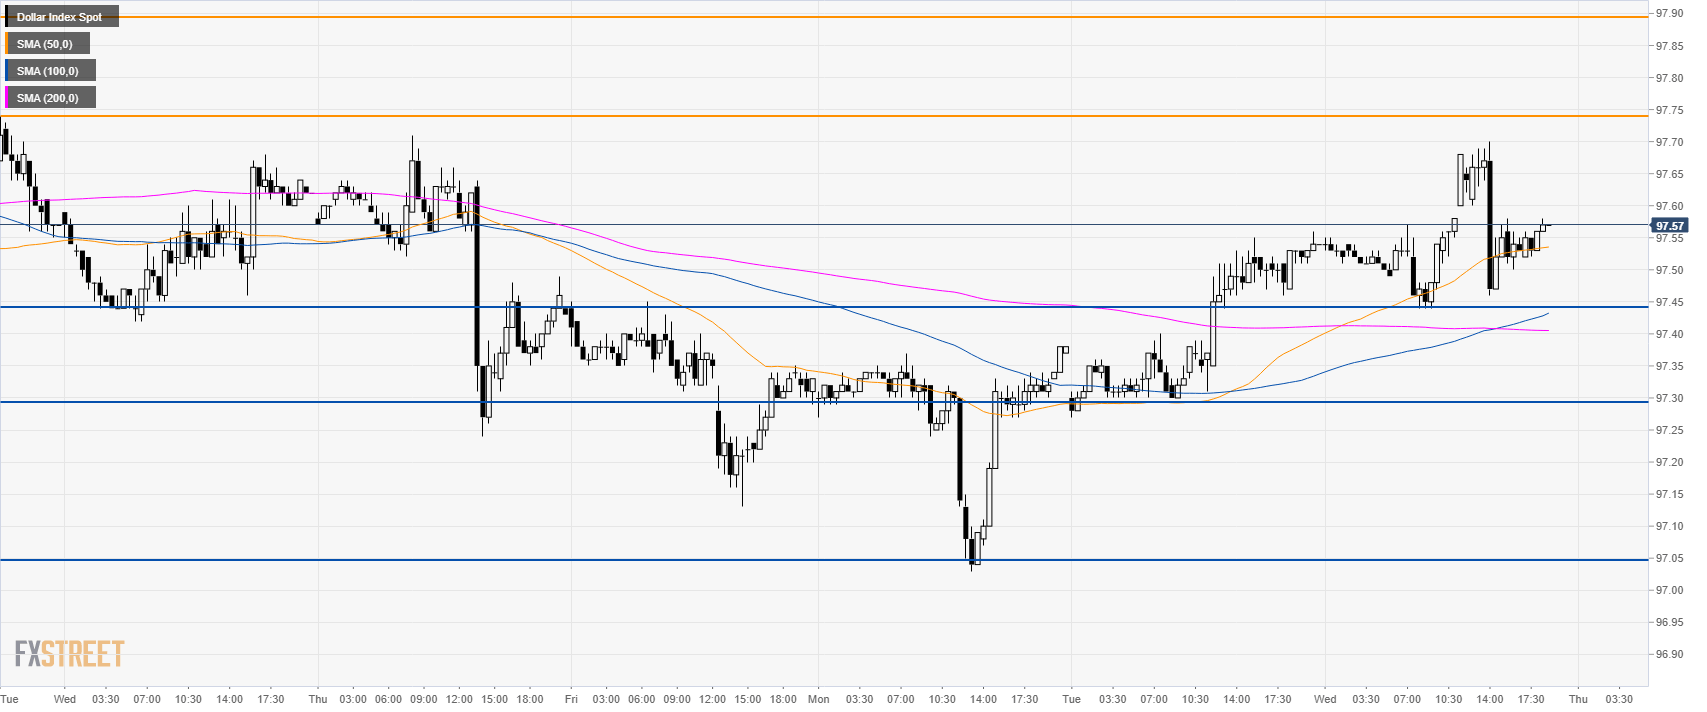
DXY 30-minute chart
DXY is trading above its main SMAs suggesting bullish momentum in the near term. Buyers will try to break 97.74 to reach 97.90 and 98.10 to the upside. Support is seen at 97.74 and 97.30 price level.
Additional key levels