16 May 2019
GBP/USD technical analysis: GBP is going down, going down …
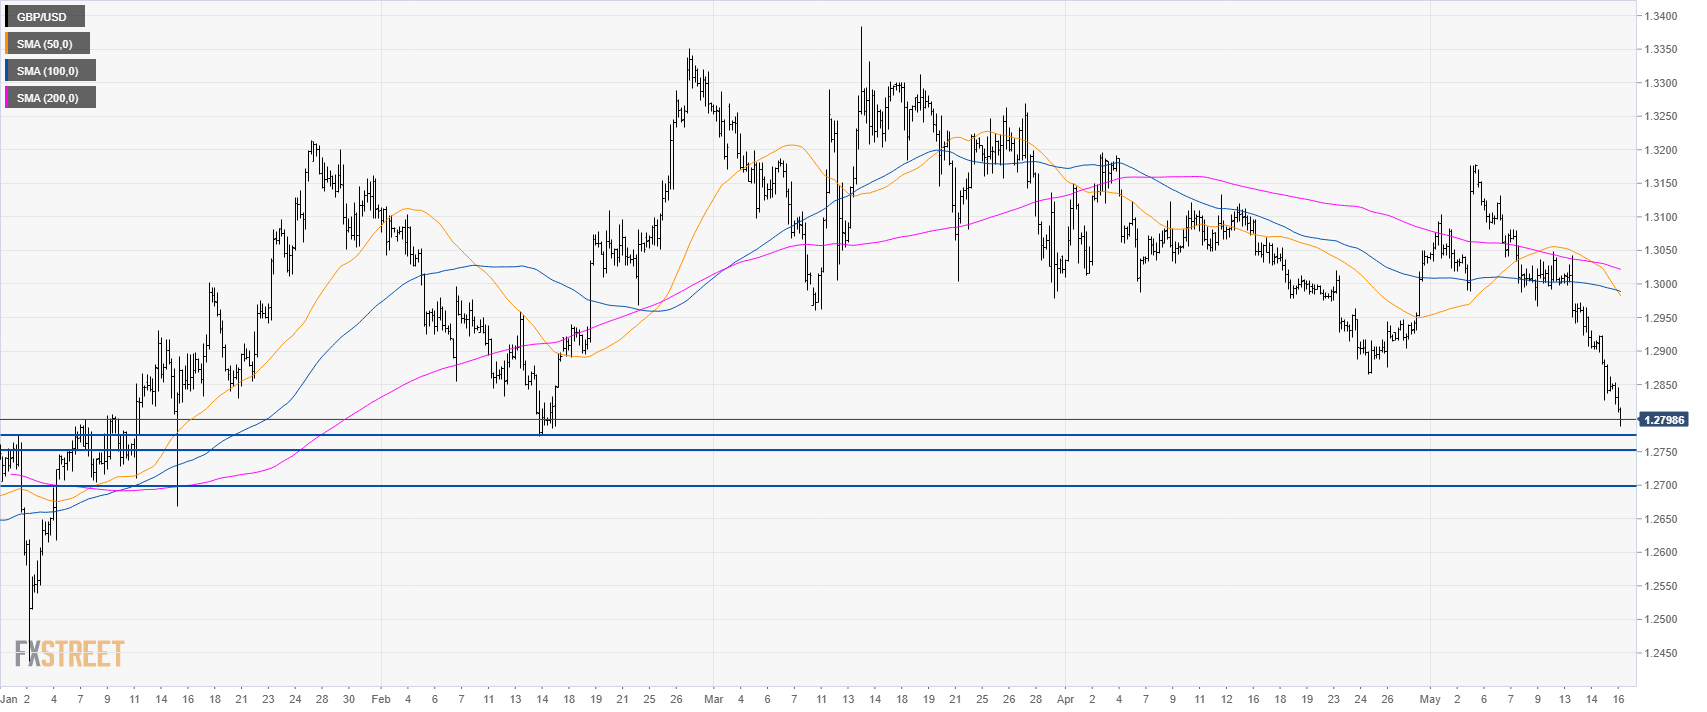
GBP/USD daily chart
GBP/USD is trading down in almost a vertical fashion below its main simple moving averages (SMAs). GBP/USD is nearing 1.2773, February low.

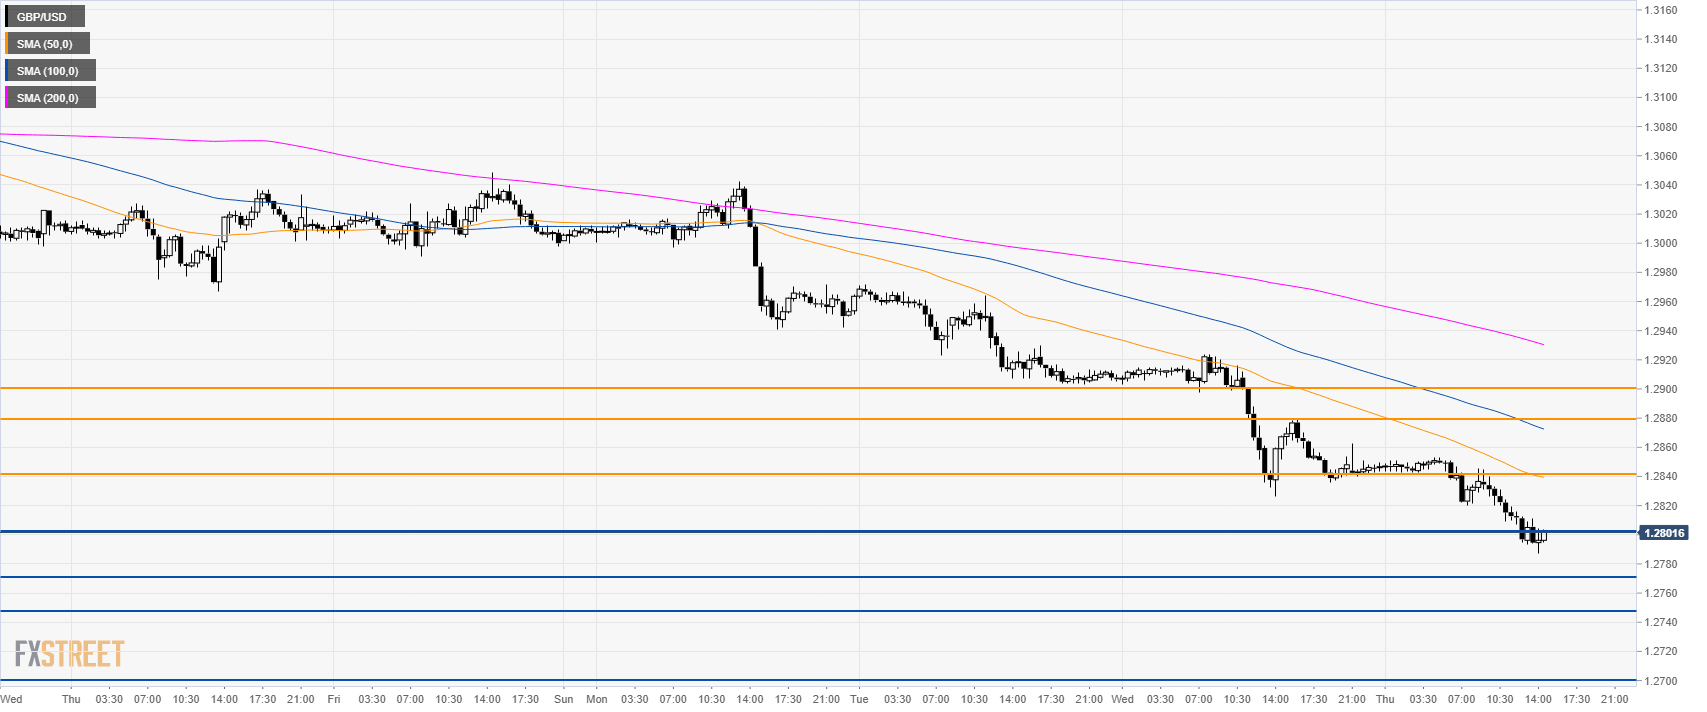
GBP/USD 4-hour chart
GBP/USD is challenging 1.2800 the figure opening the doors to further downside towards 1.2773, 1.2750 and 1.2700 figure.
GBP/USD 30-minute chart
Cable is trading below its main SMAs as the market is trading in a steep downtrend. Resistances are seen at 1.2840/80 and 1.2900 figure.
Additional key levels