21 May 2019
US Dollar Index Technical Analysis: A new visit to YTD highs around 98.30 is closer
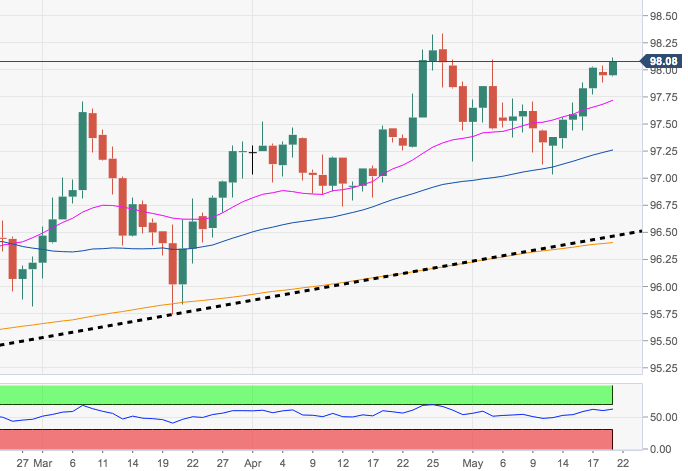
- The index manages to leave behind yesterday’s pullback and has now reclaimed the key 98.00 handle and above, resuming the underlying bullish move.
- Next on the upside appear 2019 peaks beyond 98.30. A breakout of this area on a convincing fashion should open the door for a test of the Fibo retracement at levels just below 99.00 the figure.
- The broader constructive ooutlook is expected to prevail above key 200-day SMA at 96.37 and the +3-month support line at 96.46. This area of support is reinforced by a Fibo retracement of the 2017-2018 drop at 96.36.
DXY daily chart