21 May 2019
NZD/USD technical analysis: Kiwi is under pressure near 0.6500 figure ahead of NZ Retail Sales
- The New Zealand Retail Sales for the first quarter (QoQ) will be published at 22:45 GMT this Tuesday.
- A worse-than-expected reading can keep the pressure on the NZD/USD currency pair.
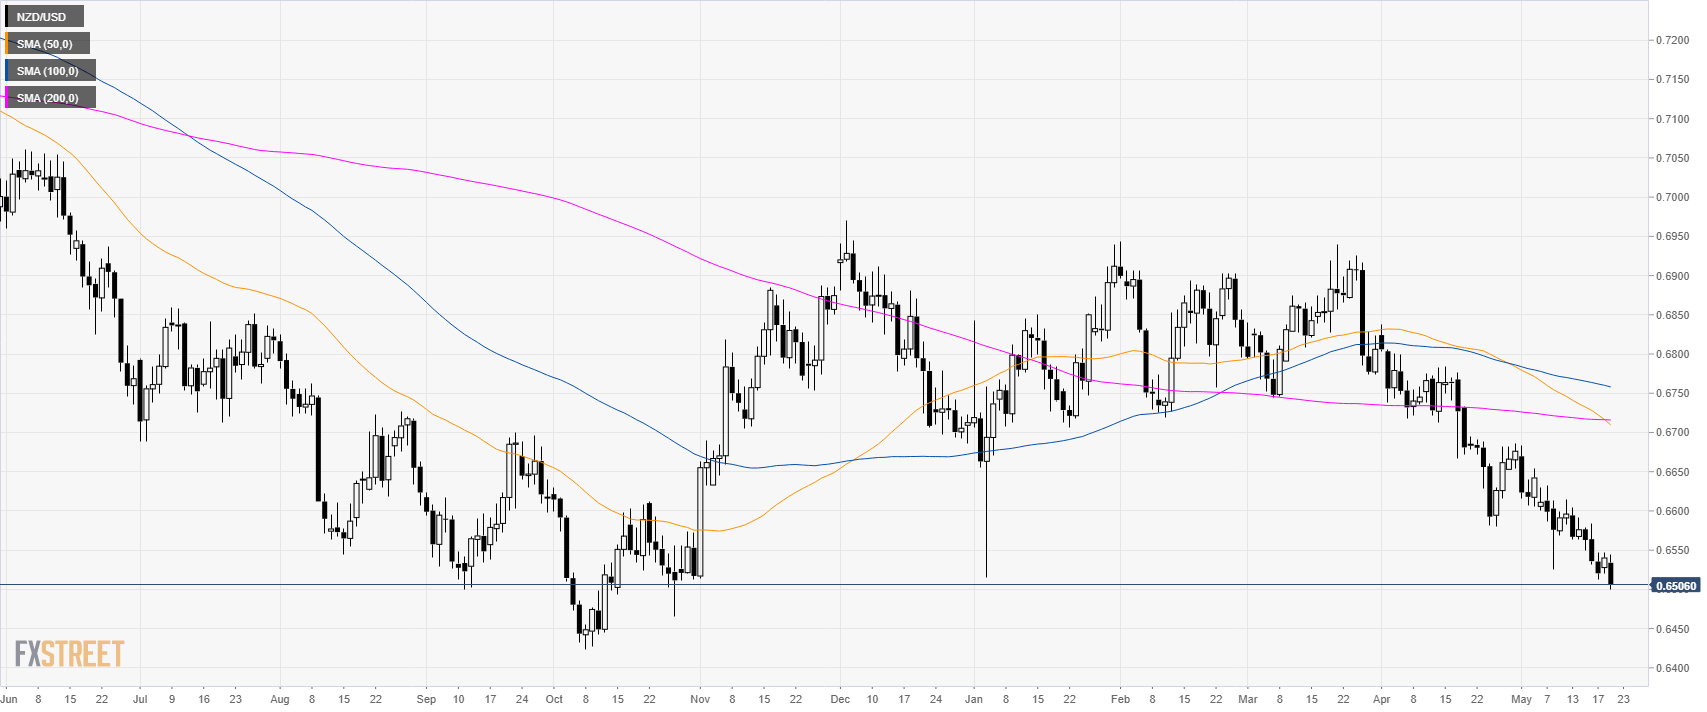
NZD/USD daily chart
NZD/USD is trading in a steep bear trend below the 0.6600 handle and its main simple moving averages (SMAs). The market is reaching levels not seen since November 2018.
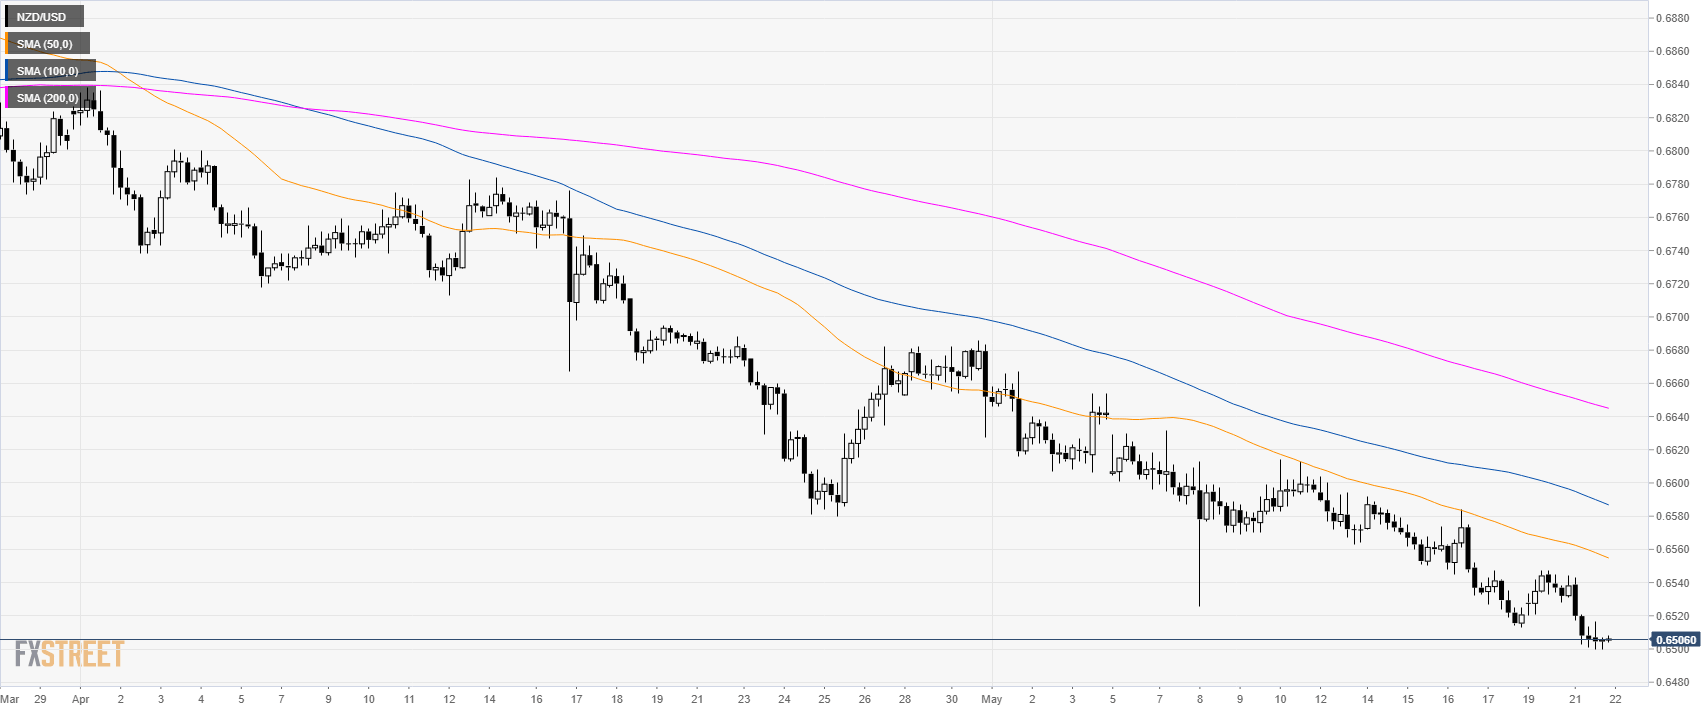
NZD/USD 4-hour chart
NZD/USD is trading below its main SMAs suggesting a bearish bias in the medium term.
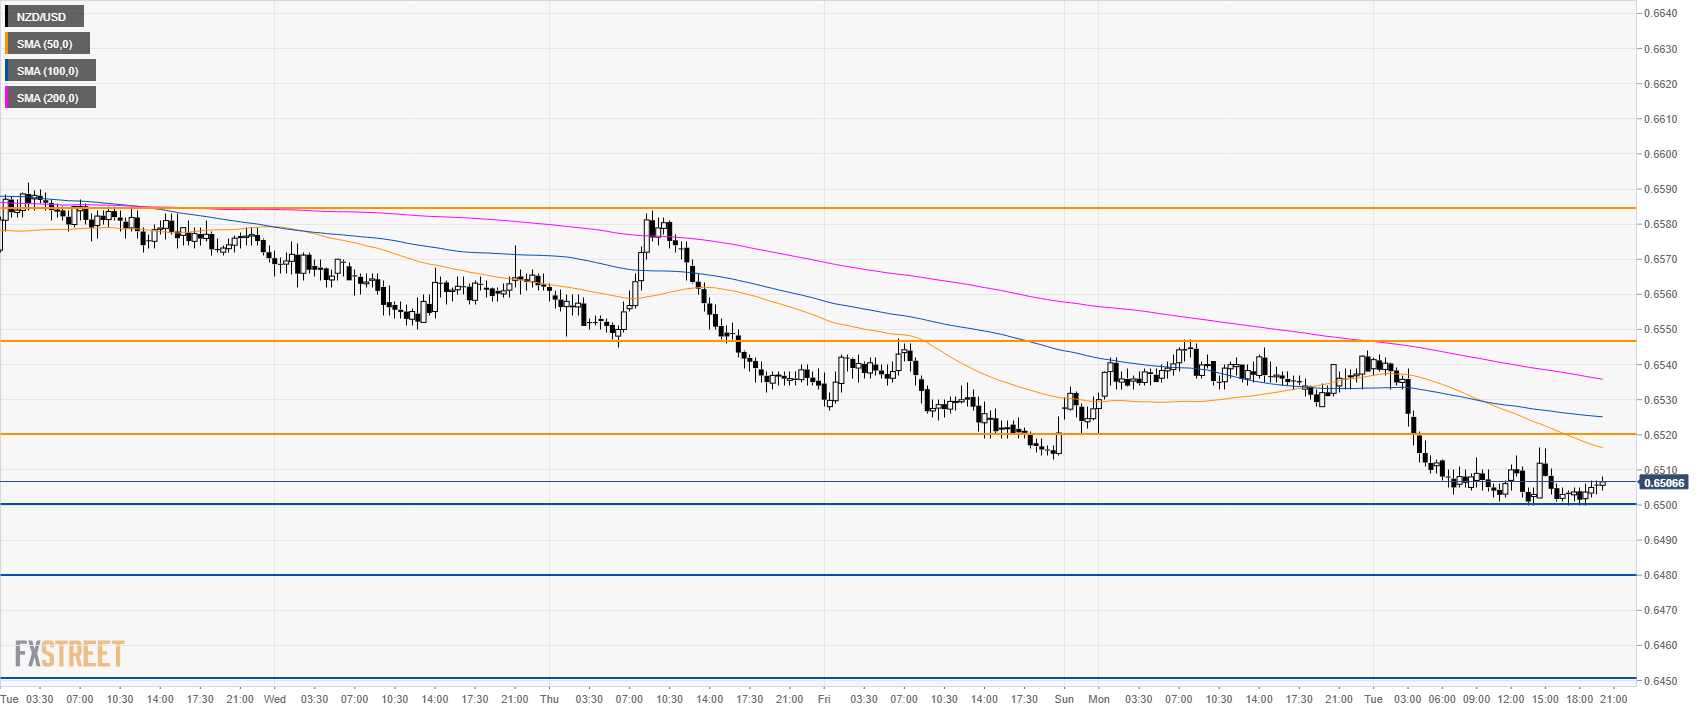
NZD/USD 30-minute chart
NZD/USD is trading in a bear trend below its main SMAs. A break below 0.6500 figure can open the gates to 0.6480 and 0.6450 level. On the way up, resistance is expected at 0.6520 and 0.6547 level.
Additional key levels