EUR/USD technical analysis: Eyes break above 1.12 after bullish engulfing candle
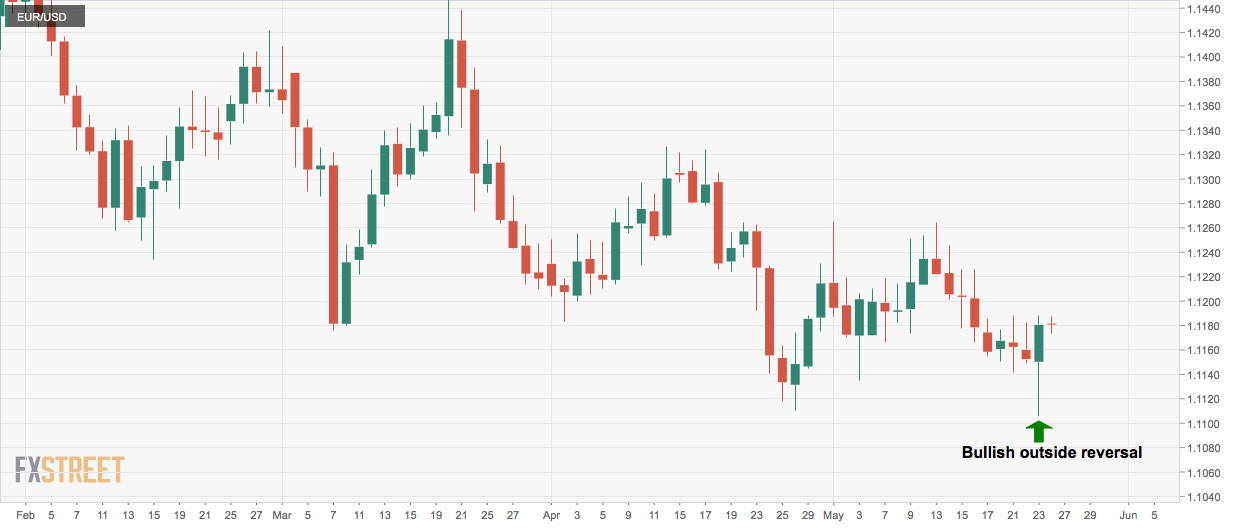
- EUR/USD looks north with bullish engulfing candle on the daily chart.
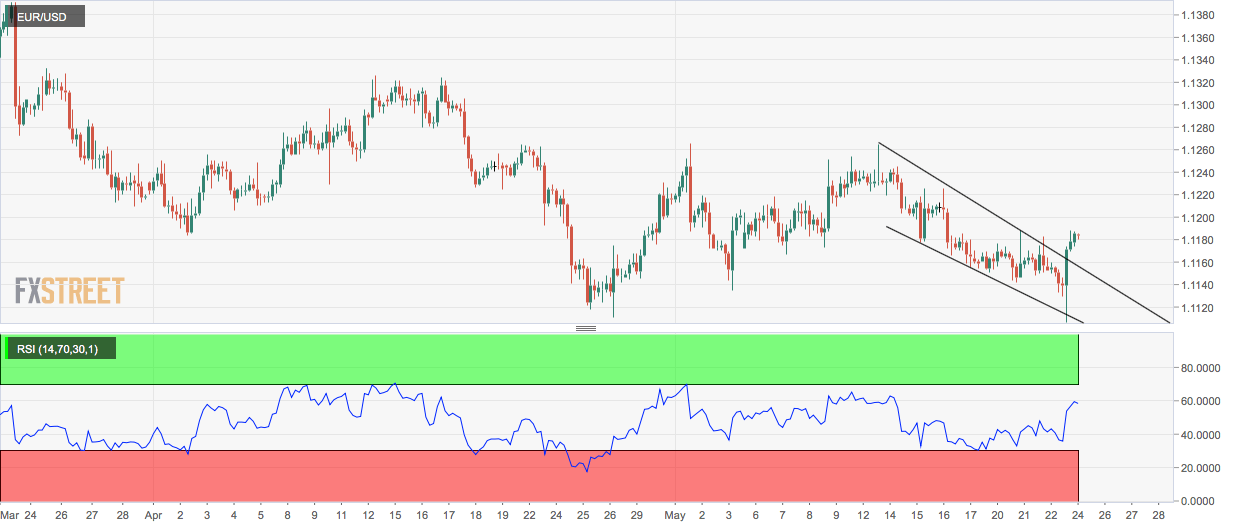
- The 4-hour chart shows a falling channel breakout.
EUR/USD is currently trading at 1.1180 and could rise well above 1.12, according to technical charts.
The pair dropped to 1.1107 yesterday before closing with gains at 1.1182, engulfing the preceding day’s high and low.
Essentially, the spot created a bullish outside reversal candle on Thursday – an early sign of bearish-to-bullish trend change.
Traders usually wait for strong confirmation, preferably in the form of a break above the high of the bullish engulfing candle.
That looks likely as the 4-hour chat is reporting a falling channel breakout and an above-50 (bullish) reading on the relative strength index (RSI).
EUR, therefore, could test the 4-hour chart 200-candle moving average, currently flatlined at 1.1216.
Daily chart
4-hour chart
Trend: Bullish
Pivot points