
USD/IDR technical analysis: Less activity between the key MAs
- Sustained trading beneath long-term MA indicates the quote’s weakness.
- Lack of momentum prevails around 61.8% Fibo.
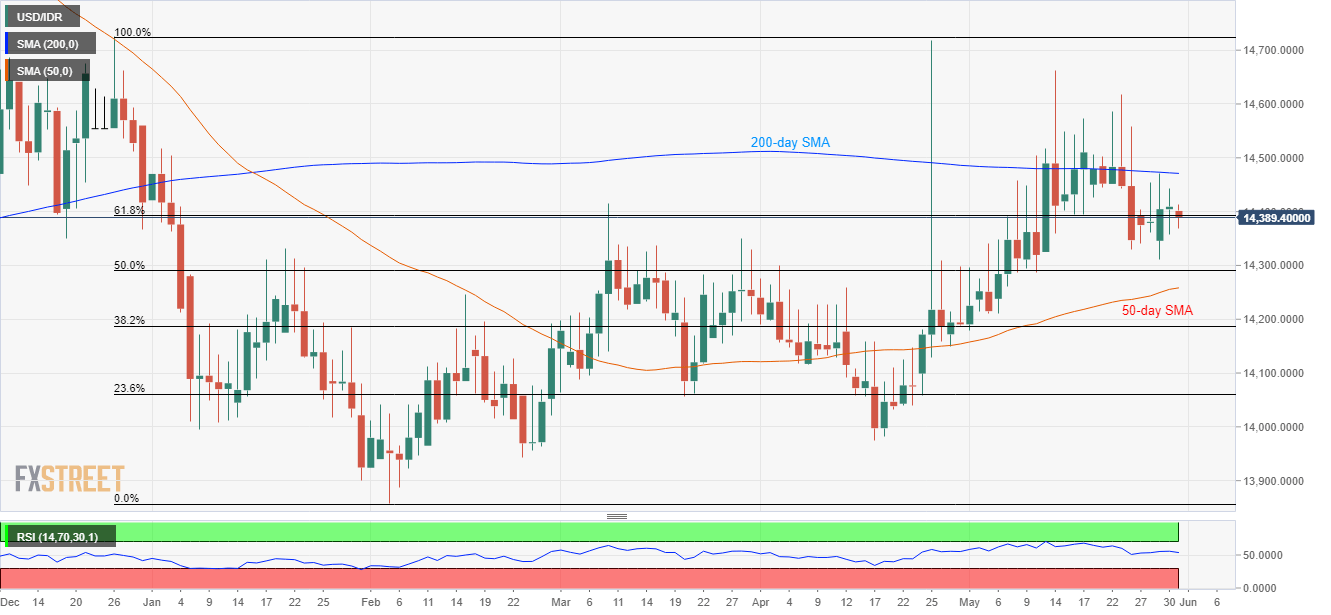
Having reversed from 200-day SMA, the USD/IDR pair trades near 14,390 during early Friday.
The pair clings to 61.8% Fibonacci retracement of its late-December 2018 to February downturn with repeated failures to cross the key simple moving average (SMA) favoring the further downside.
In doing so, the quote can take an intermediate rest at 50% Fibonacci retracement level of 14,290 ahead of meeting 50-day SMA level near 14,260.
If bears refrain from respecting 14,260, 14,100 and 14,000 could flash on their radar to target.
On the contrary, a successful break of 200-day SMA level of 14,475 becomes prerequisite for the pair to trigger fresh upside towards 14,550 and 14,660.
During the quote’s extended rise past-14,660, 14,720/25 area gains market attention as it also includes the current year high.
USD/IDR daily chart
Trend: Sideways to negative