14 Jun 2019
Gold technical analysis: Bulls testing bear commitments at five-year-long resistance
- The 20&50 4HR EMAs are offering support and the price can move towards 1357.66 as the 2014-2019 resistance line.
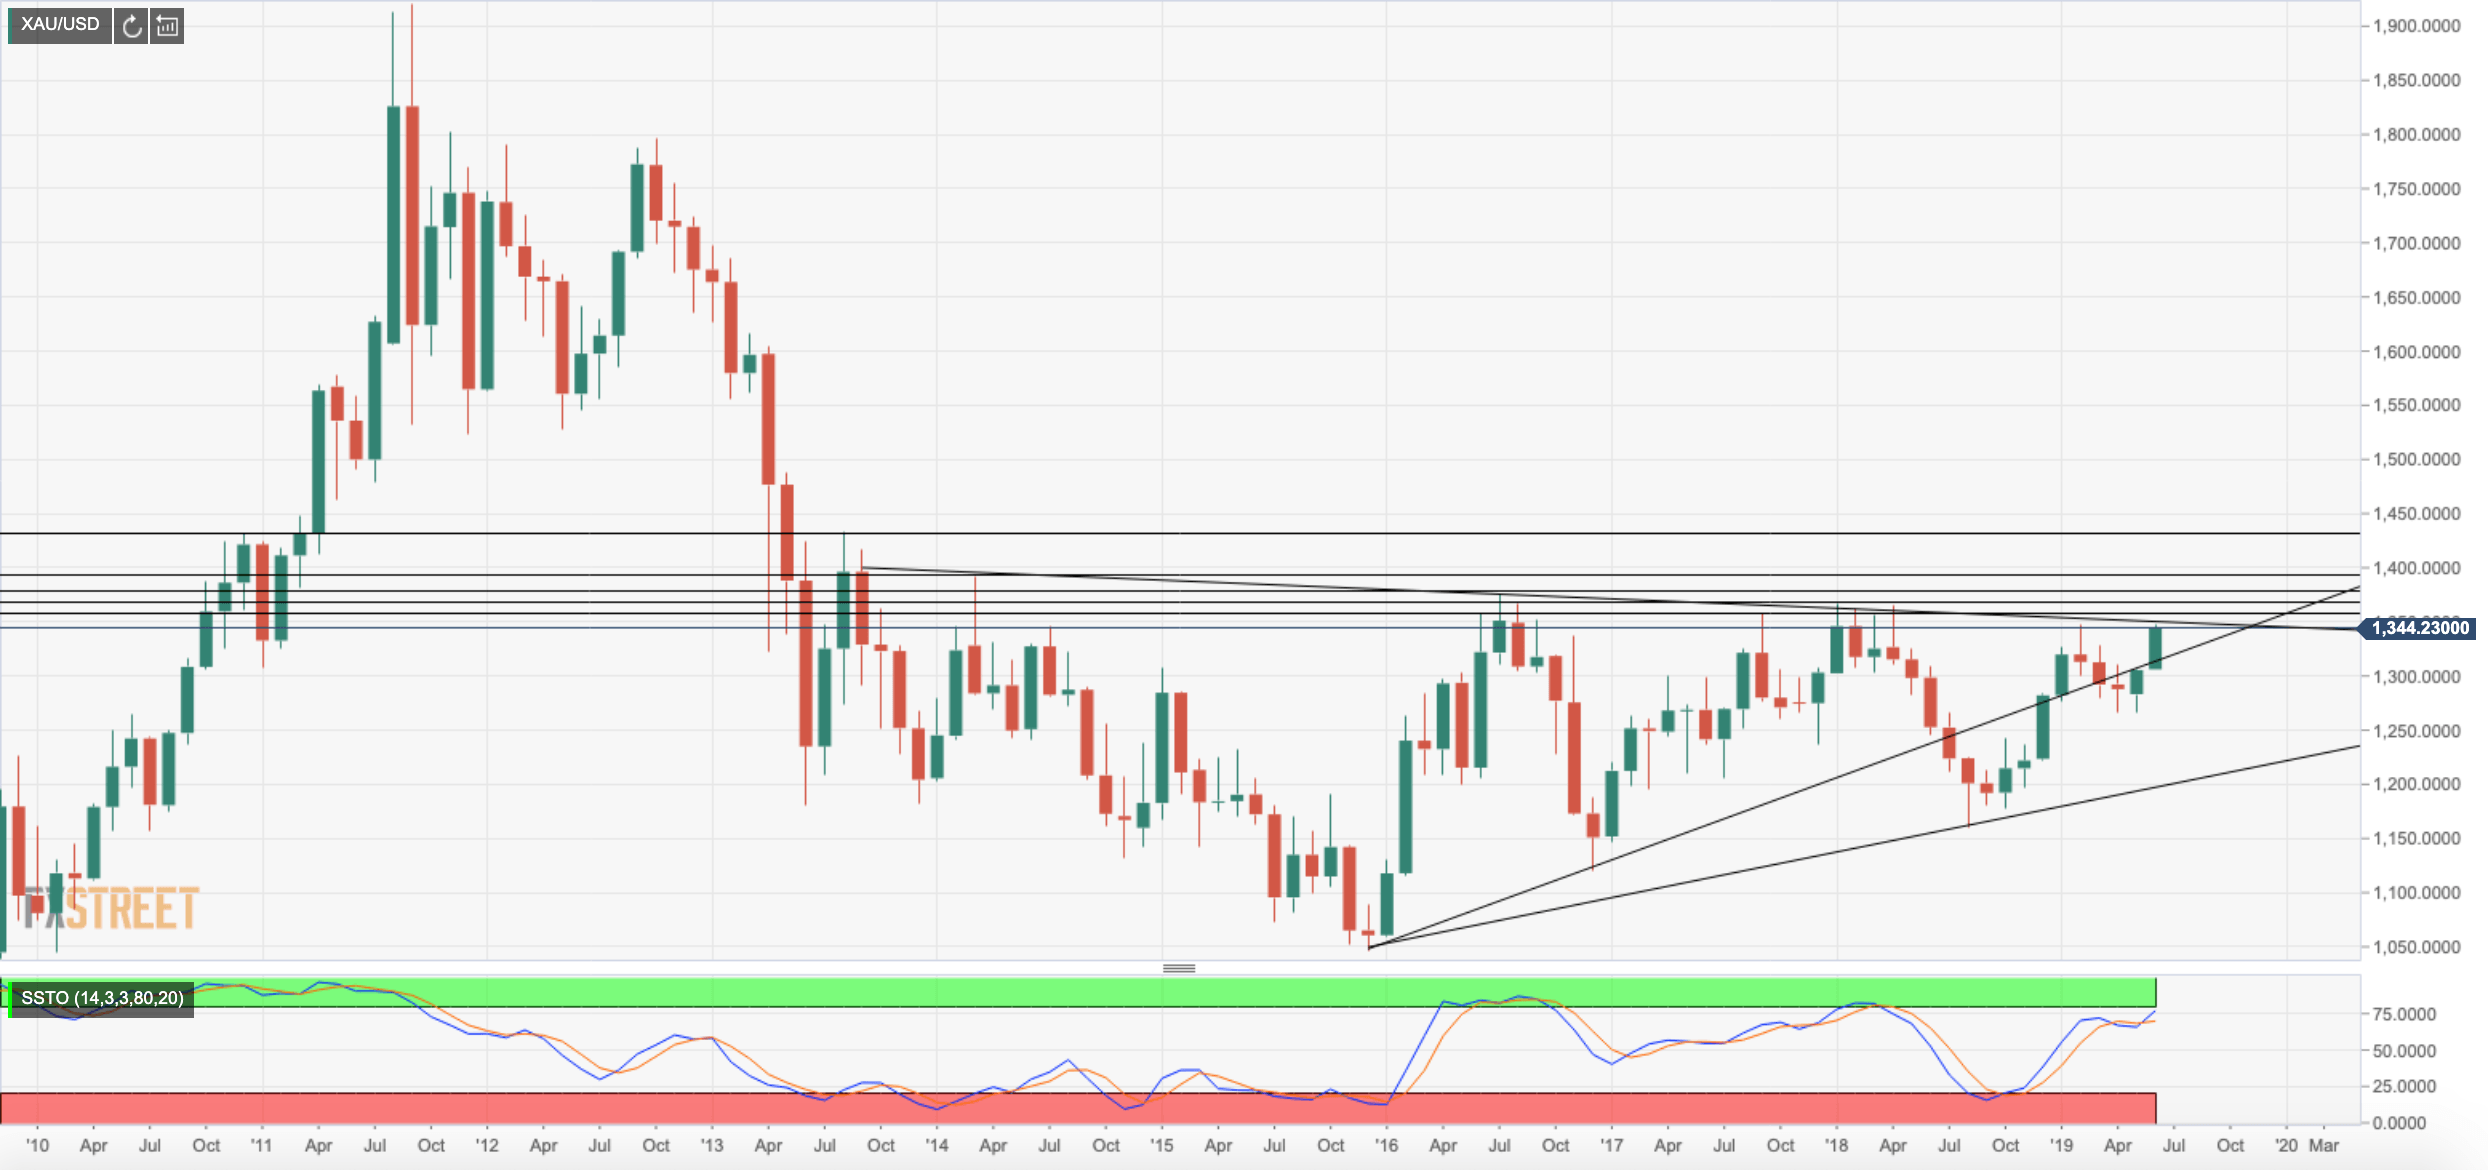
- We are in the running of a five-year-long breakout according to the monthly chart below.
- The Jan and April highs come in around 1365.
- However, it must be noted that the price is moving into overbought territory.
- To the downside, 1320 is guarding 1311 and 1303/06 to open 1297.
- 1297 level meets the 50% Fibo retracement of the late April and early May double-bottom swing lows to recent spike high.
- The 55-week ma sits at around 1260s and the 200-week ma comes in at 1250s.