17 Jun 2019
USD/CAD technical analysis: Greenback consolidates last week gains near 1.3400 handle
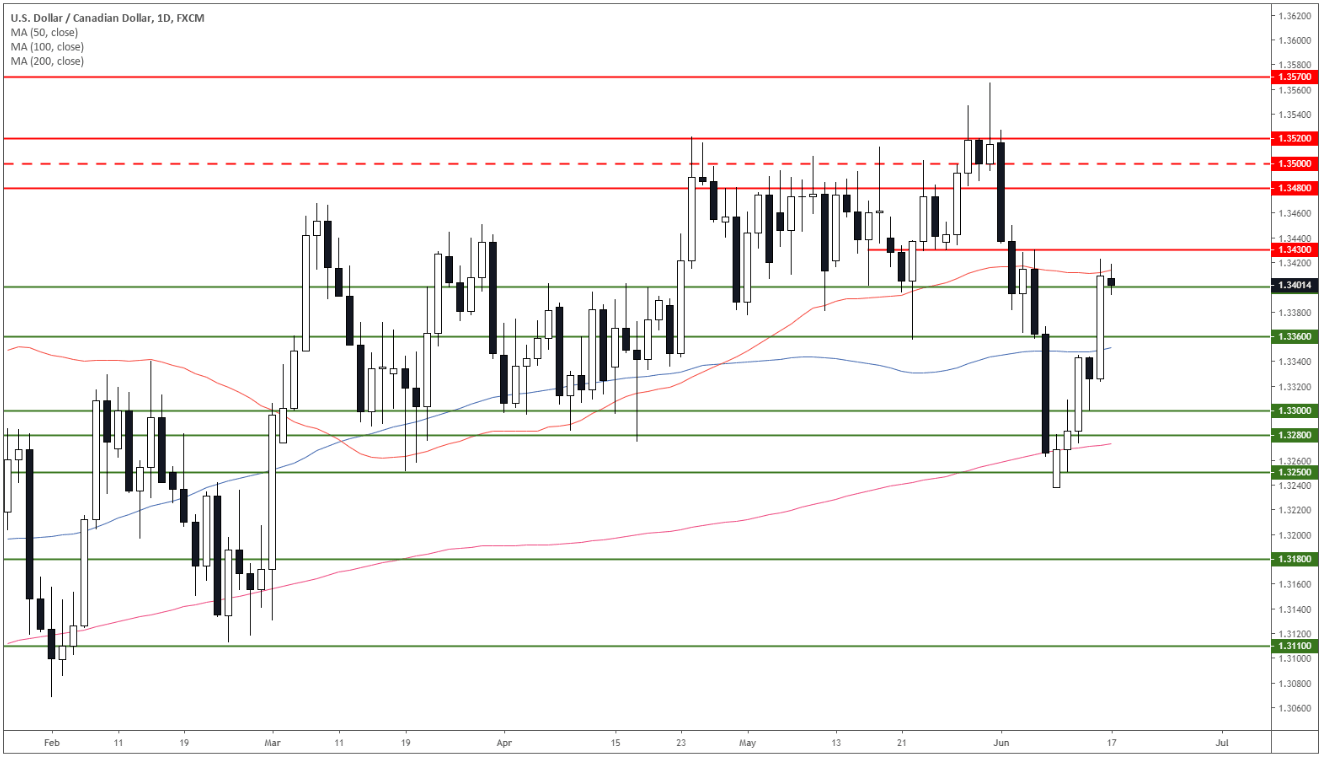
USD/CAD daily chart
USD/CAD is trading in a bull trend above its 100 and 200-day simple moving average (DSMA). Last week bulls recovered quite some ground bouncing from the 200 DSMA.
USD/CAD 4-hour chart
USD/CAD is consolidating in the 1.3400-1.3430 zone just below the 200 SMA. The market is gathering some momentum above the 50 SMA.

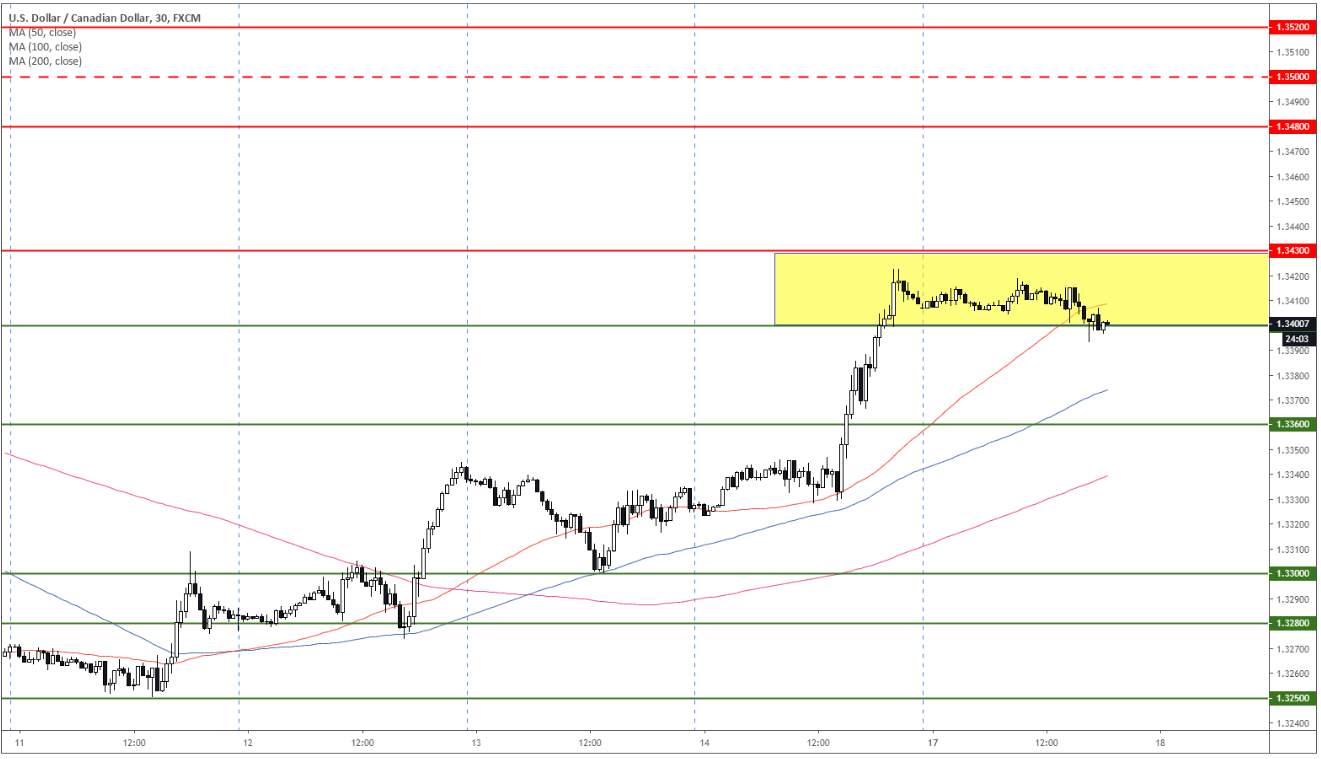
USD/CAD 30-minute chart
The currency pair is trading above 1.3300 support and its main SMAs suggesting bullish momentum. A break above 1.3430 can lead to 1.3480 and 1.3500 figure. Support is at 1.3360 and 1.3300.
Additional key levels