GBP/JPY technical analysis: U-turn from 2-week old resistance-line highlights 200-HMA
- A fortnight-long descending trend-line limits immediate upside.
- Declining RSI from the overbought area favors the pullback to 200-HMA.
With a downward sloping trend-line since June 13 restricting the GBP/JPY pair’s upside, the quote drops to 136.75 during early Asian morning on Thursday.
Not only the pair’s U-turn from key resistance-line but declining levels of 14-bar relative strength index (RSI) from the overbought region also favors the pullback towards the important support level comprising 200-hour moving average (200-HMA) at 136.45.
If at all sellers refrain from respecting 200-HMA, a 9-day old ascending trend-line at 135.90 becomes crucial to watch as it holds the key for the pair’s slump to the month’s low near 135.37.
On the upside break above 136.88, 61.8% Fibonacci retracement of mid-month decline, at 137.20 seems a tough resistance.
Should prices rally past-137.20, June 13 top surrounding 137.80 and 138.33 can become buyers’ favorites.
GBP/JPY hourly chart
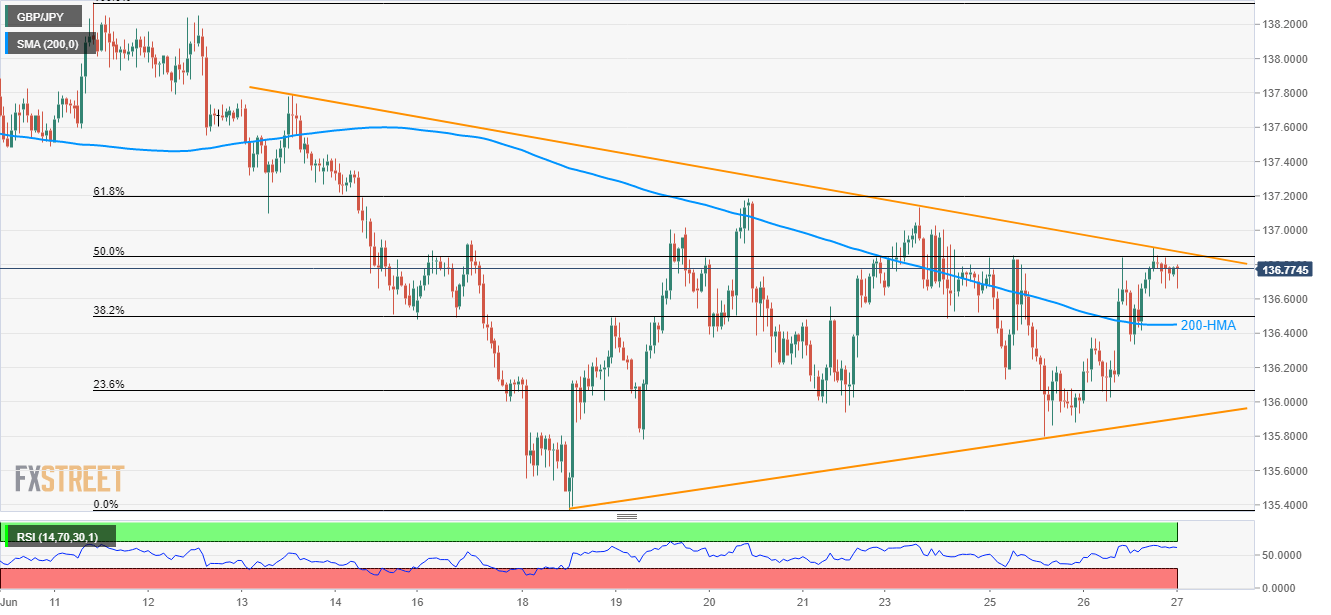
Trend: Pullback expected