8 Jul 2019
USD/INR technical analysis: 61.8% Fibo./200-week MA flash on sellers’ radar
- The sustained trading below 50% Fibonacci retracement and the absence of oversold RSI signal further the USD/INR pair’s downside.
- Bears can aim for 61.8% Fibonacci retracement, 200-week moving average during further downside.
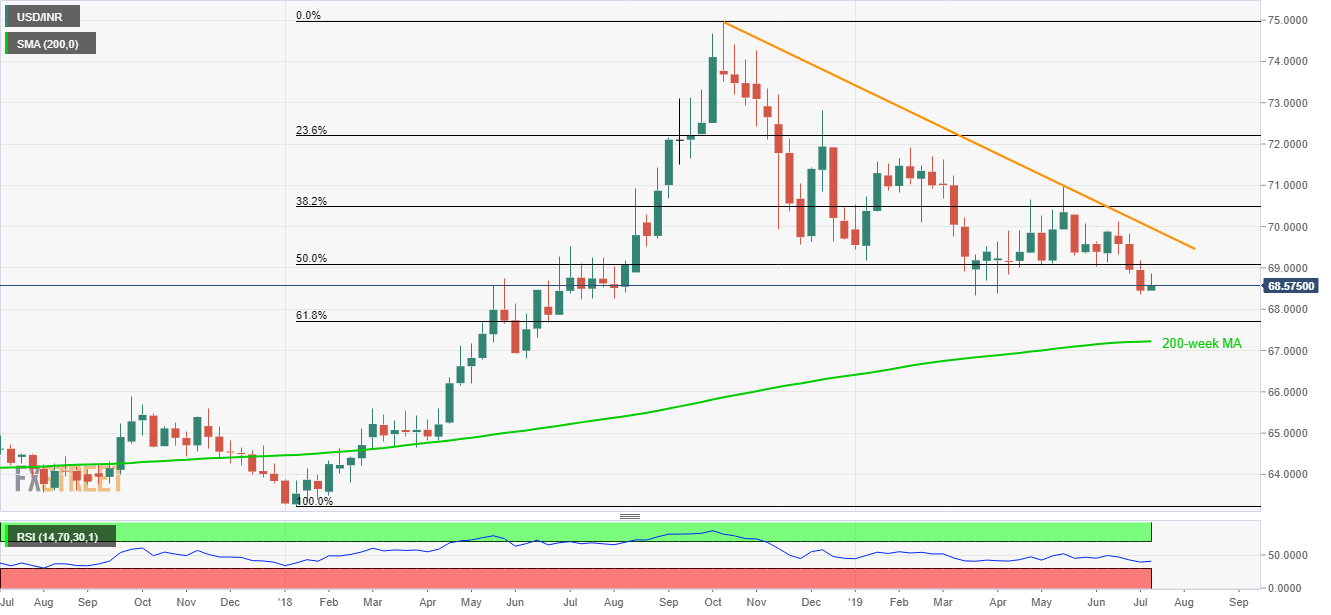
A sustained trading below 50% Fibonacci retracement of the year 2018 upside signals the USD/INR pair’s weakness as it takes the rounds to 68.56 on early Monday.
The 14-bar relative strength index (RSI) also stays away from oversold conditions and indicate room for further declines towards key supports namely 61.8% Fibonacci retracement level of 67.71 and 200-week moving average (MA) around 67.23.
In a case prices keep trading southwards past-67.23, June 2018 low close to 66.80 can please the bears.
On the upside, 50% Fibonacci retracement of 69.10 and a downward sloping trend-line since October 2018 at 70.00 can keep exerting downside pressure on the pair.
USD/INR weekly chart
Trend: Bearish