15 Jul 2019
GBP/USD technical analysis: Cable approaching 1.2500 as the London session comes to end
- GBP/USD is challenging last Friday’s low as it is hovring above 1.2500.
- Critical support is seen at 1.2483 according to the Technical Confluences Indicator.
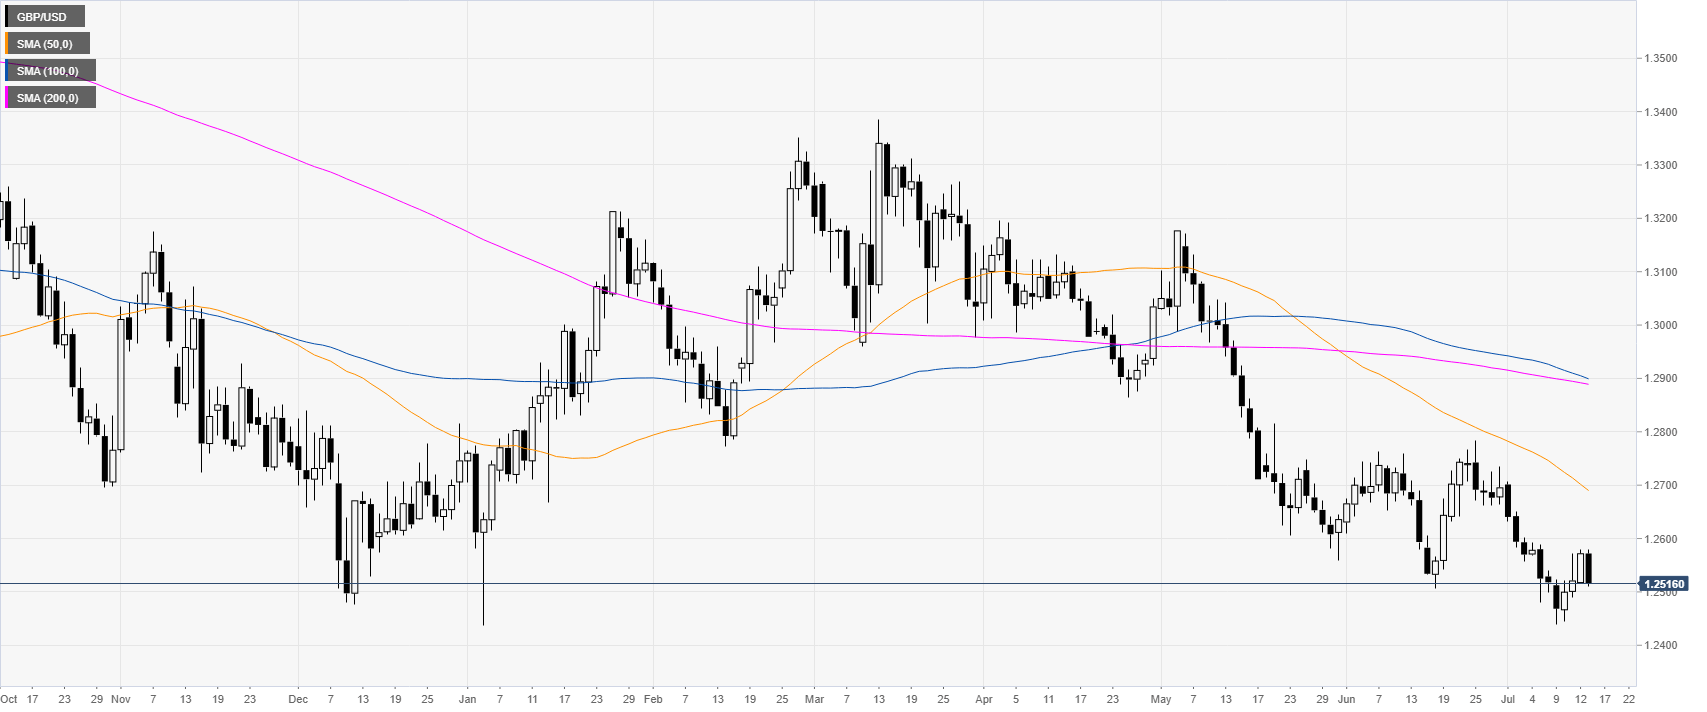
GBP/USD daily chart
GBP/USD is in a bear trend below its main daily simple moving averages (DSMAs). The market is challenging last Friday’s low just above 1.2500.
GBP/USD 4-hour chart
GBP/USD broke below 1.2536 support. Bears intend to drive the market towards 1.2483 level, according to the Technical Confluences Indicator. The market is also trading below its main SMAs sugesting bearish momentum.

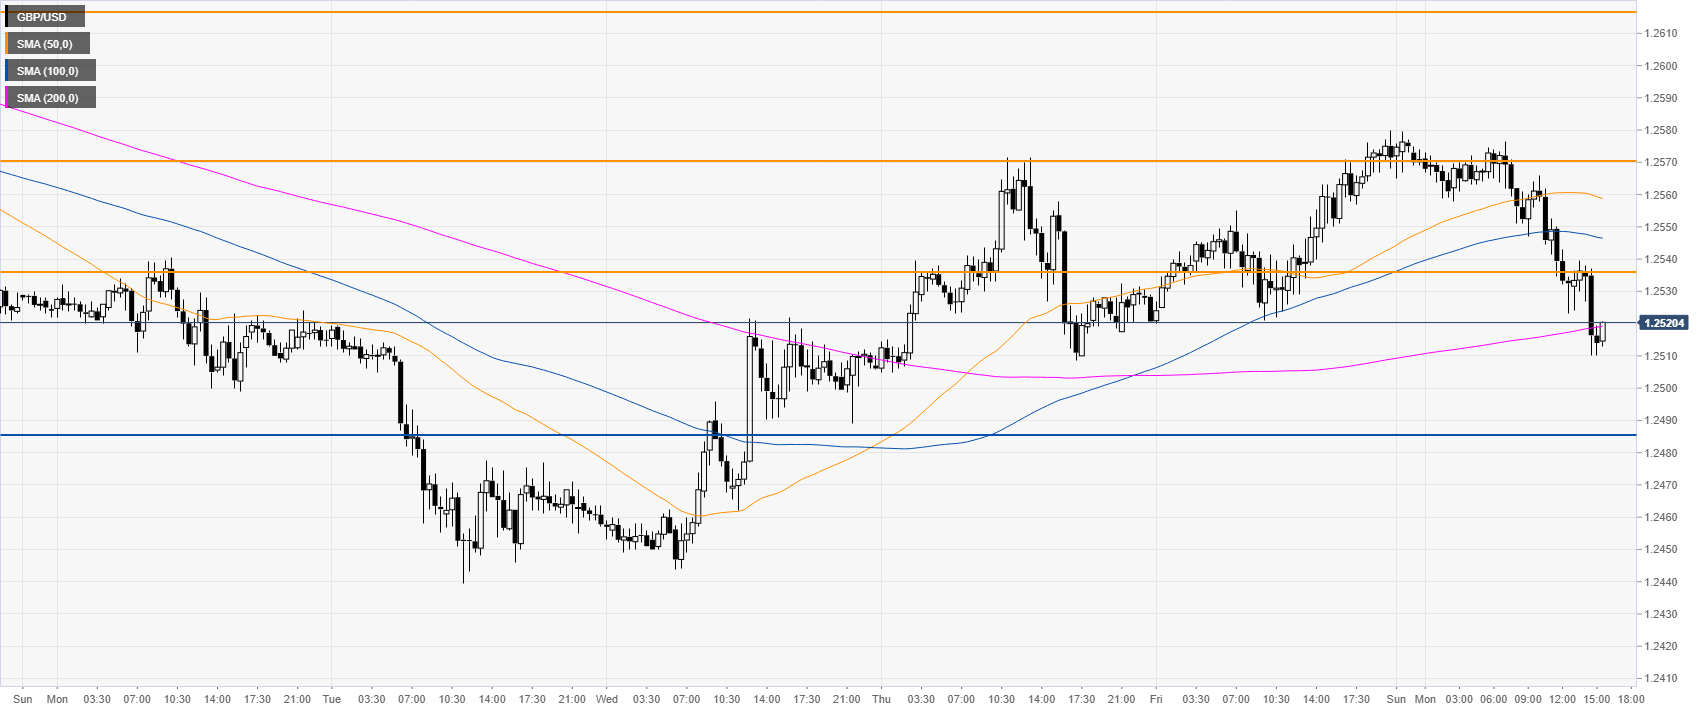
GBP/USD 30-minute chart
The market is challenging the 200 SMA above the 1.2500 figure. Resistance can be seen at 1.2536 and 1.2570, according to the Technical Confluences Indicator.
Additional key levels