16 Jul 2019
DXY technical analysis: DXY gathering strength and approaching July’s highs
- DXY makes a big leap trading above 97.30 this Tuesday.
- The level to beat for bulls is 97.55 and 97.80.
DXY daily chart
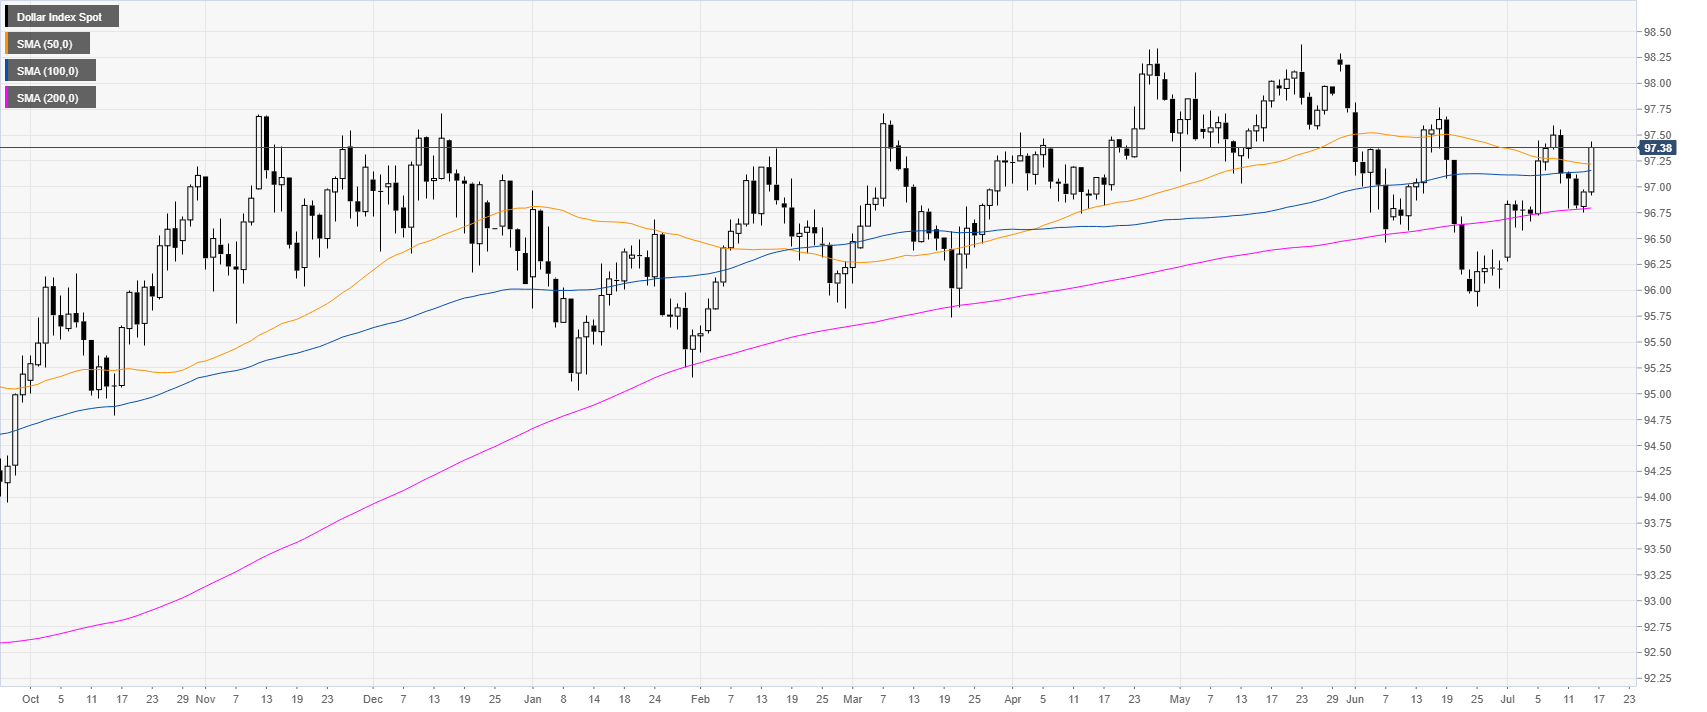
The US Dollar Index (DXY) is trading in a bull trend just above its main simple moving average (DSMA).
DXY 4-hour chart
The market is approaching July’s highs near 97.55 as th emarket is trading above its main SMAs. A break above 97.55 can lead to 97.80 to the upside.

DXY 30-minute chart
The 50 SMA crossed above the 200 SMA which can be considered as bullish. Immediate support is seen at the 97.30 and 97.15 levels.

Additional key levels