AUD/NZD technical analysis: 100-DMA exerts downside pressure
- AUD/NZD repeatedly fails to clear 100-DMA.
- 21-DMA, 1.0400 seem nearby supports to watch.
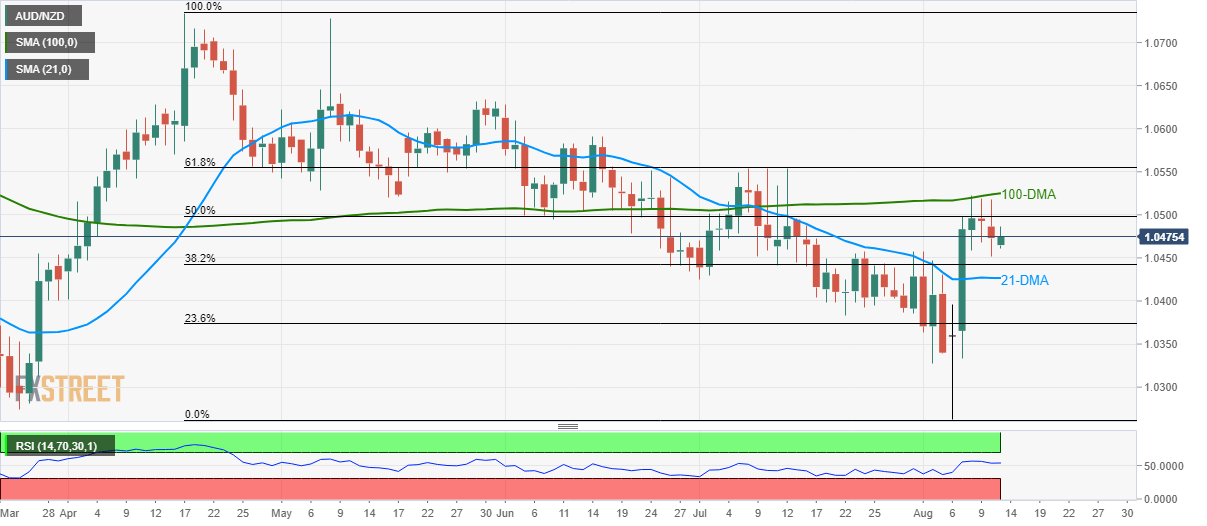
Despite its latest recovery, AUD/NZD remains below the 100-day simple moving average (DMA) while trading near 1.0475 on early Tuesday.
With the pair’s repeated failures to rise beyond near-term key resistance, chances of its declines to 21-DMA level of 1.0427 and then a consequent declines to 1.0400 round-figure are much brighter.
If the quote drops beneath 1.0400 round-figure, 23.6% Fibonacci retracement of April – August south-run around 1.0375 could please sellers.
On the upside, 50% Fibonacci retracement level of 1.0500 acts as immediate resistance ahead of 100-DMA level of 1.0525.
Given the pair’s ability to rise past-1.0525 on a daily closing basis, 61.8% Fibonacci retracement level of 1.0555 and mid-June high near 1.0590 can come back on the chart
AUD/NZD daily chart
Trend: Bearish