15 Aug 2019
Oil technical analysis: WTI consolidates losses below $55.00 a barrel
- WTI is down for the second consecutive day.
- The levels to beat for bears is $54.00 a barrel.
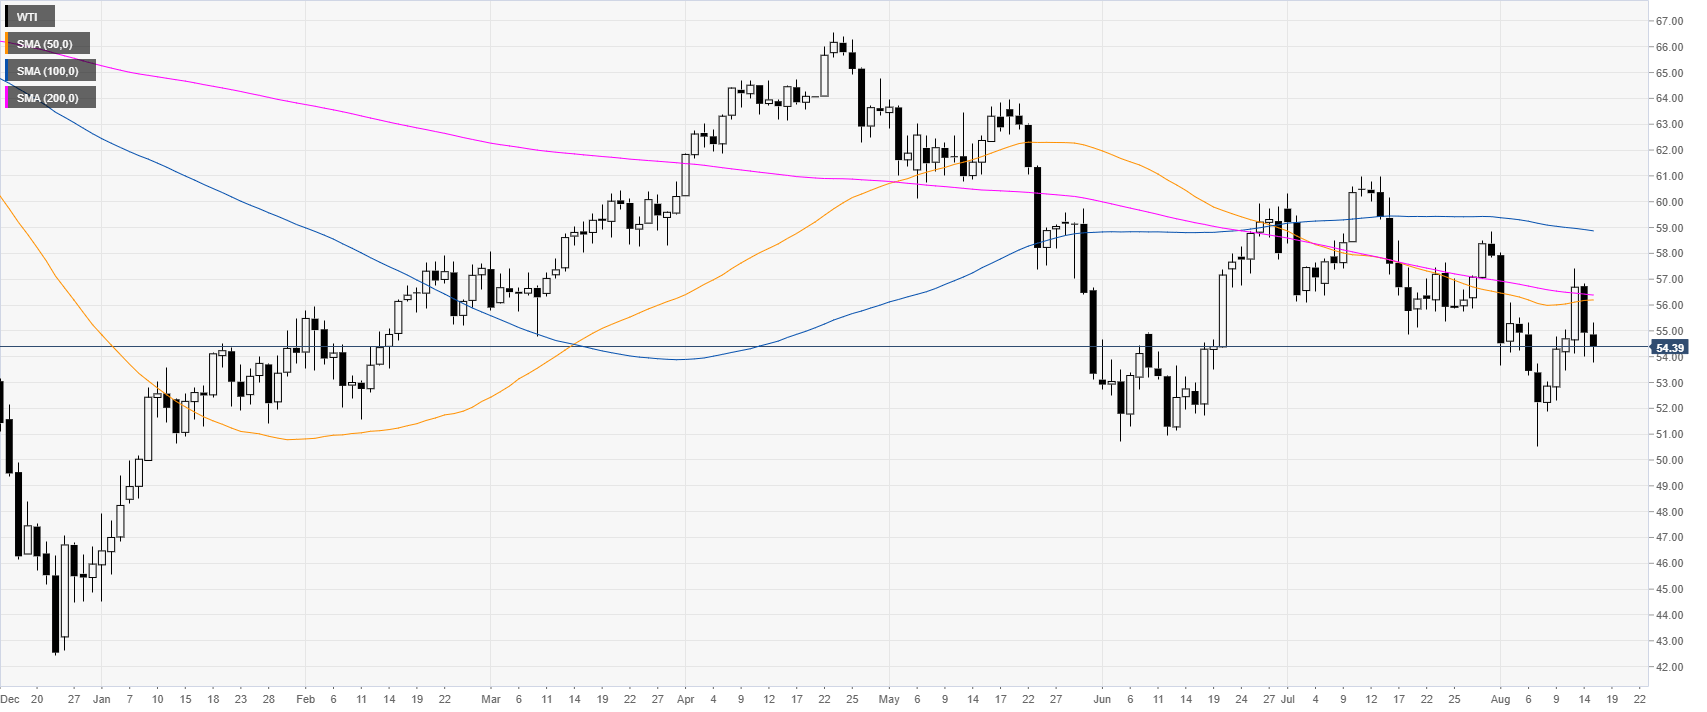
Oil daily chart
WTI (West Texas Intermediate) is trading below $55.00 a barrel and its main daily simple moving averages (SMAs). Oil is down for the second consecutive day as the market rejected the 57.00 level and the 50/200 SMA on Wednesday.
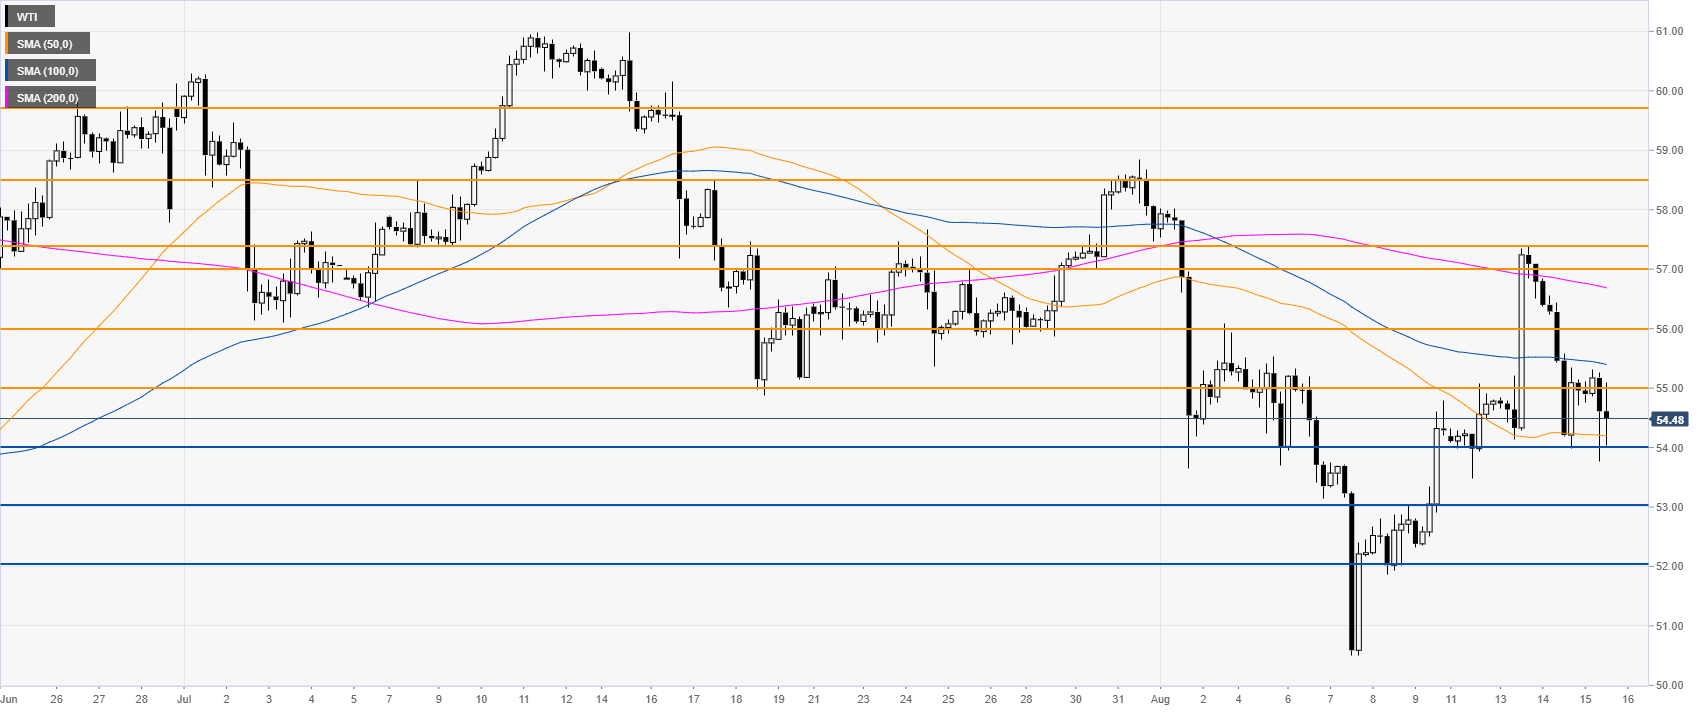
Oil 4-hour chart
WTI is consolidating the recent losses between the 54.00 and 55.00 levels. The market is trading below its 100/200 SMA and seems rather weak. A break below 54.00 can lead to 53.00 and 52.00 on the way down.
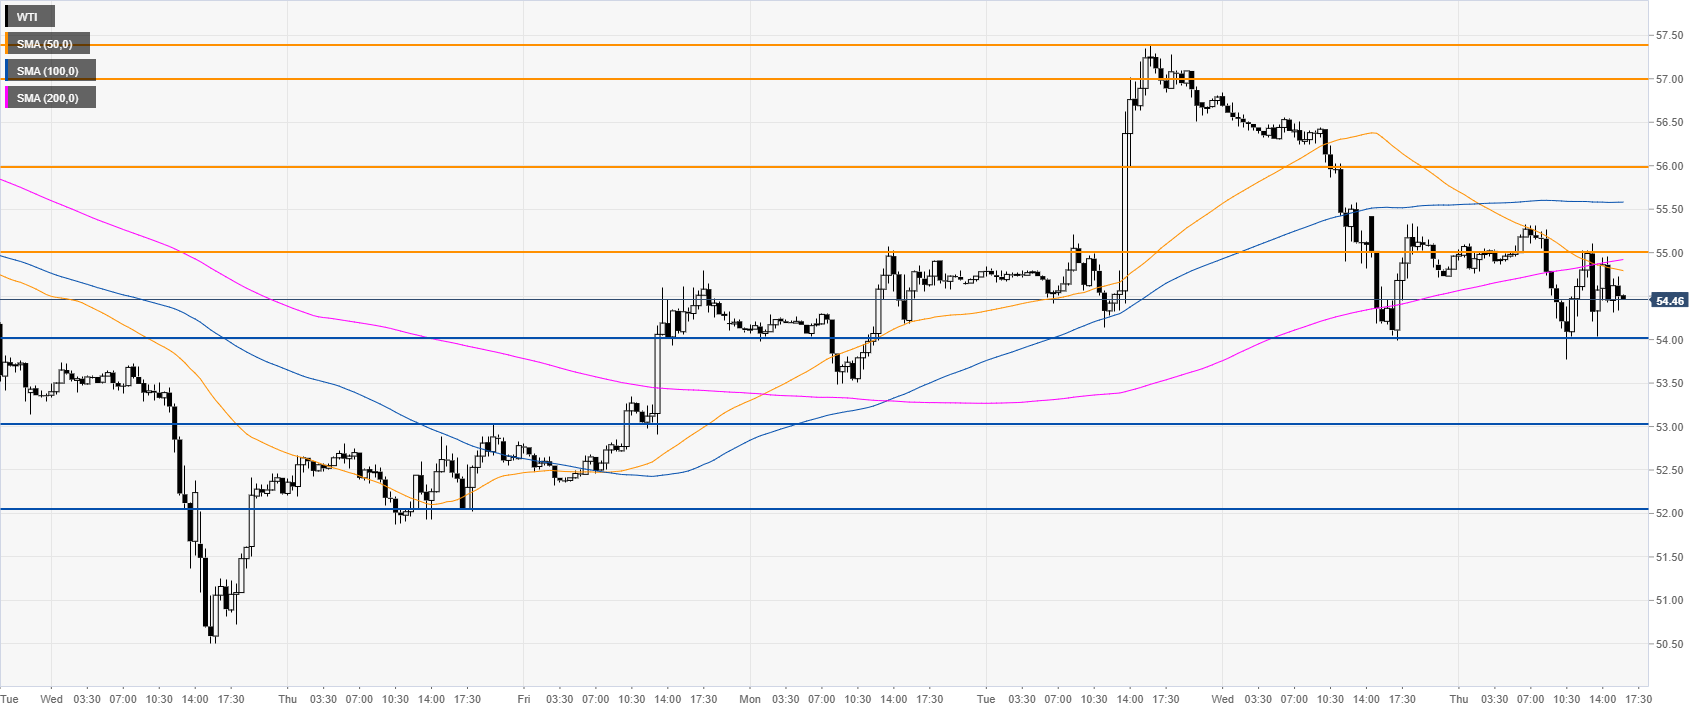
Oil 30-minute chart
Black gold could find immediate resistance at the 55.00 level as the market is under pressure below its 200 SMA.
Additional key levels