19 Aug 2019
S&P500 Index technical analysis: US stocks testing a key resistance at the 2,930.00 level
- The S&P500 is challenging a critical resistance at the 2,930.00 level.
- On the way up bulls can set their eyes on the 2,970.00 and 3,020.00 resistances.
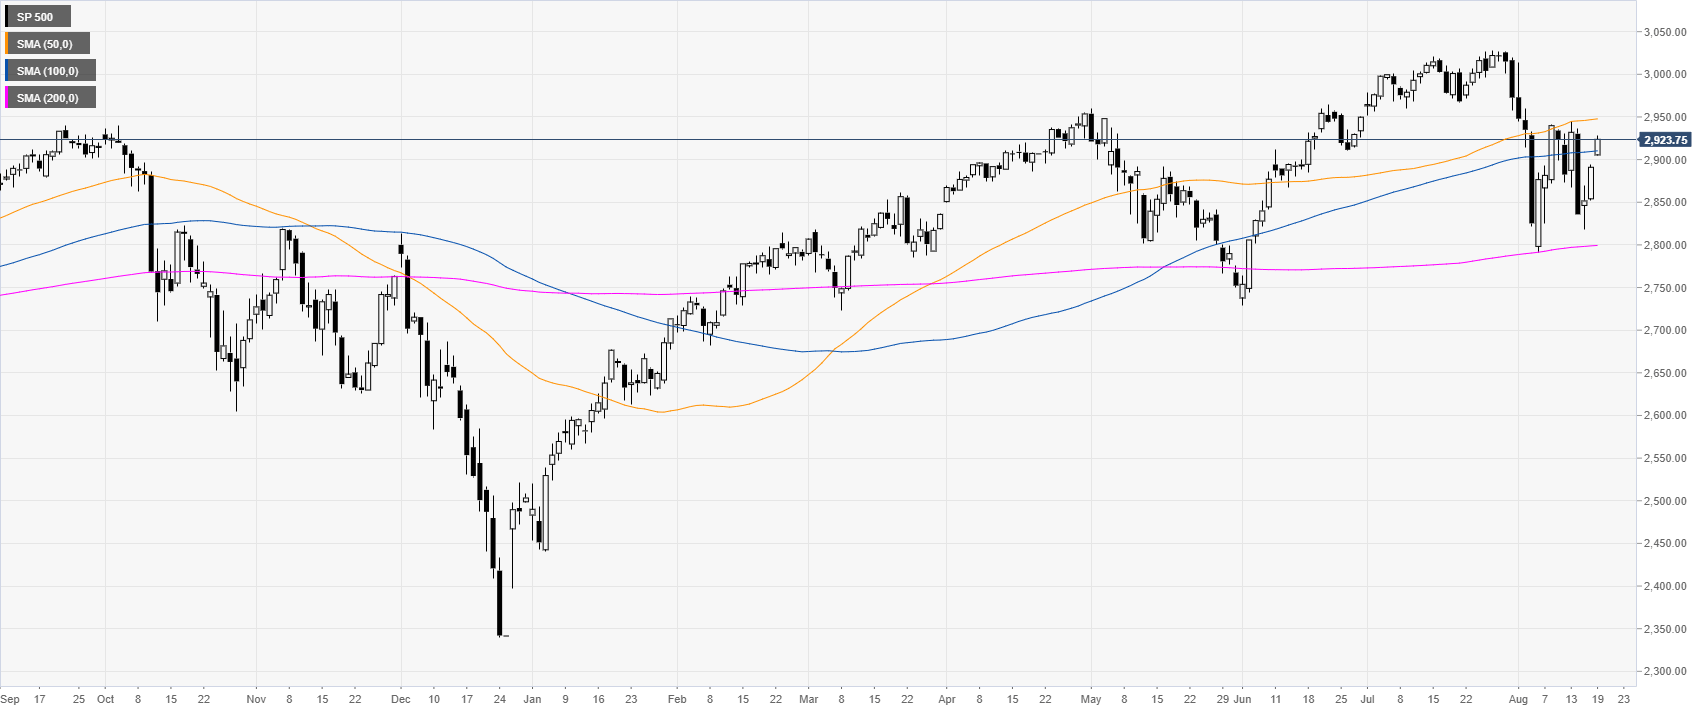
S&P500 daily chart
The S&P 500 Index is trading above the 2,900.00 handle and the 50/100 day simple moving averages (DSMAs) as the market is up for the third consecutive day.
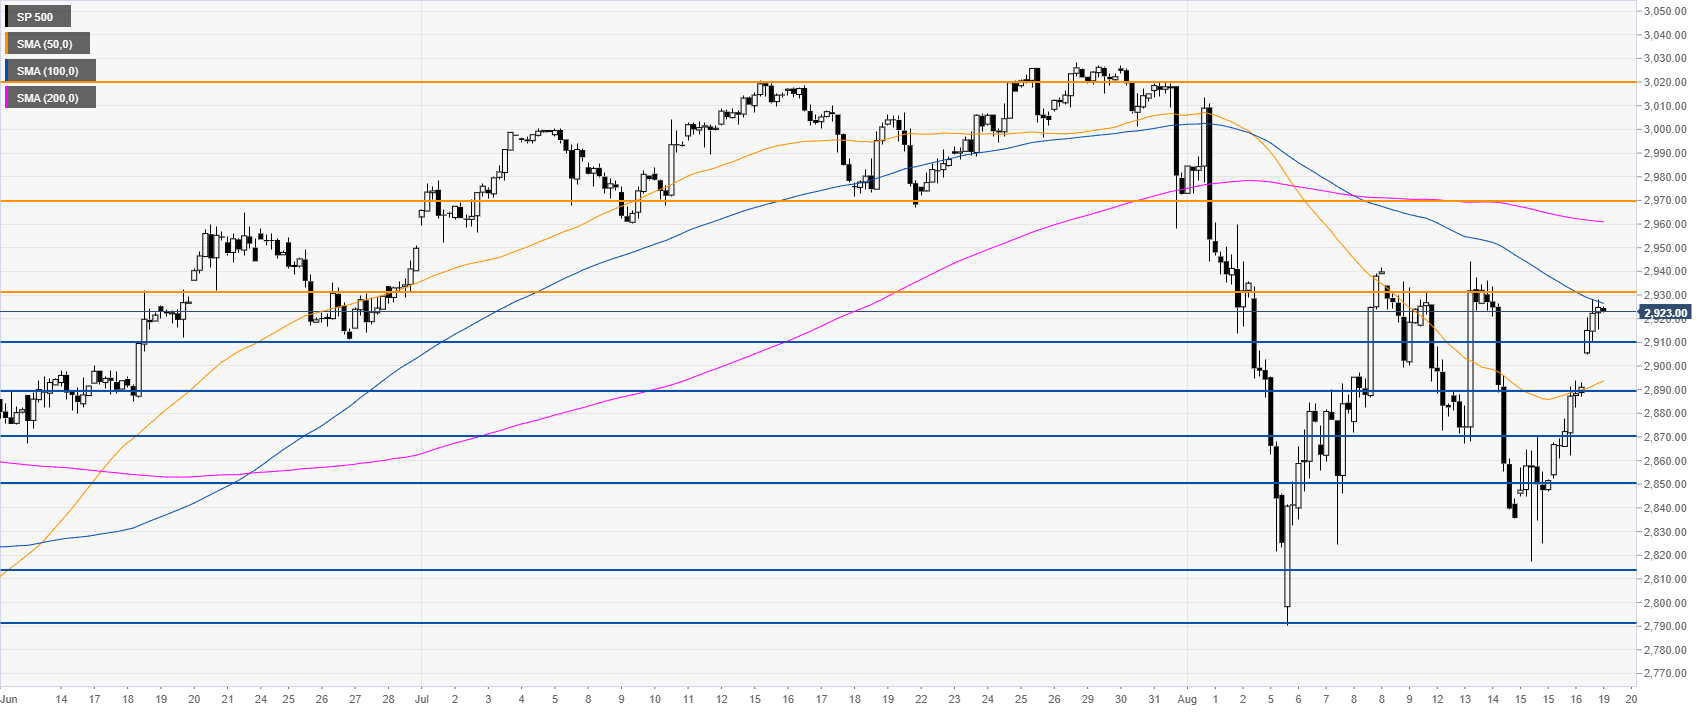
S&P500 4-hour chart
The market is challenging the 2,930.00 resistance and the 100 SMA. Bulls need to clear this level to drive to index towards 2,970.00 and 3,020.00 resistances. Immediate support is at 2,910.00; 2,890.00 and the 2,870.00 levels.
Additional key levels