20 Aug 2019
US Dollar Index technical analysis: DXY retreating below the 98.38 resistance into the London close
- DXY (US Dollar Index) retreated below the 98.38 resistance in the New York session.
- Resistances on the way up could be located at 98.38, 98.68 and 98.93 (2019 high).
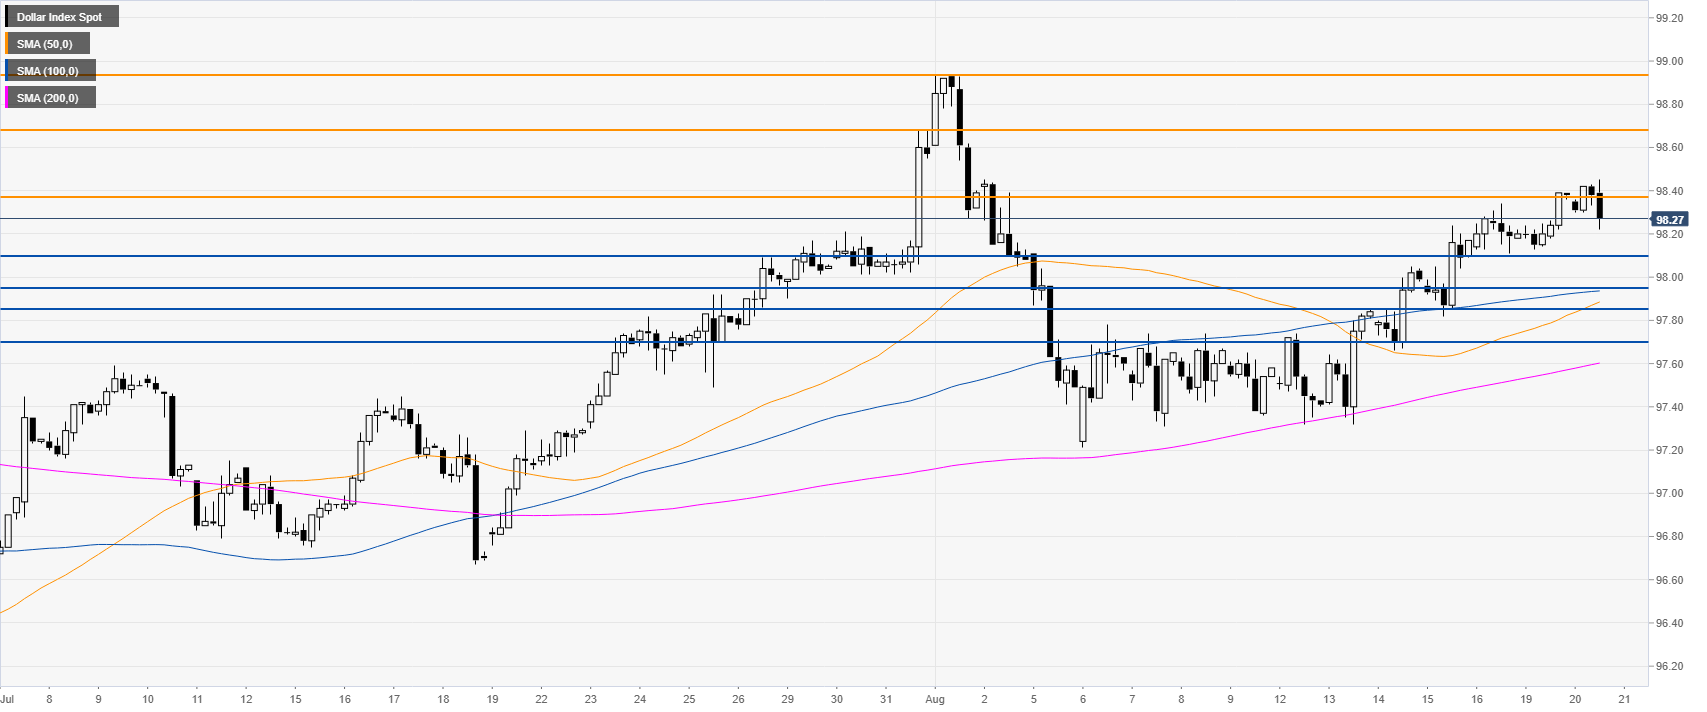
DXY daily chart
DXY (US Dollar Index) is in a bull trend above its main daily simple moving averages (DSMAs). The Greenback has accelerated to the upside in the second part of the New York session this Monday.

DXY 4-hour chart
DXY is retreating below the 98.38 level as the market is retreating slightly. The market remains poised to appreciate towards 98.68 and potentially to 98.93 level (2019 high).
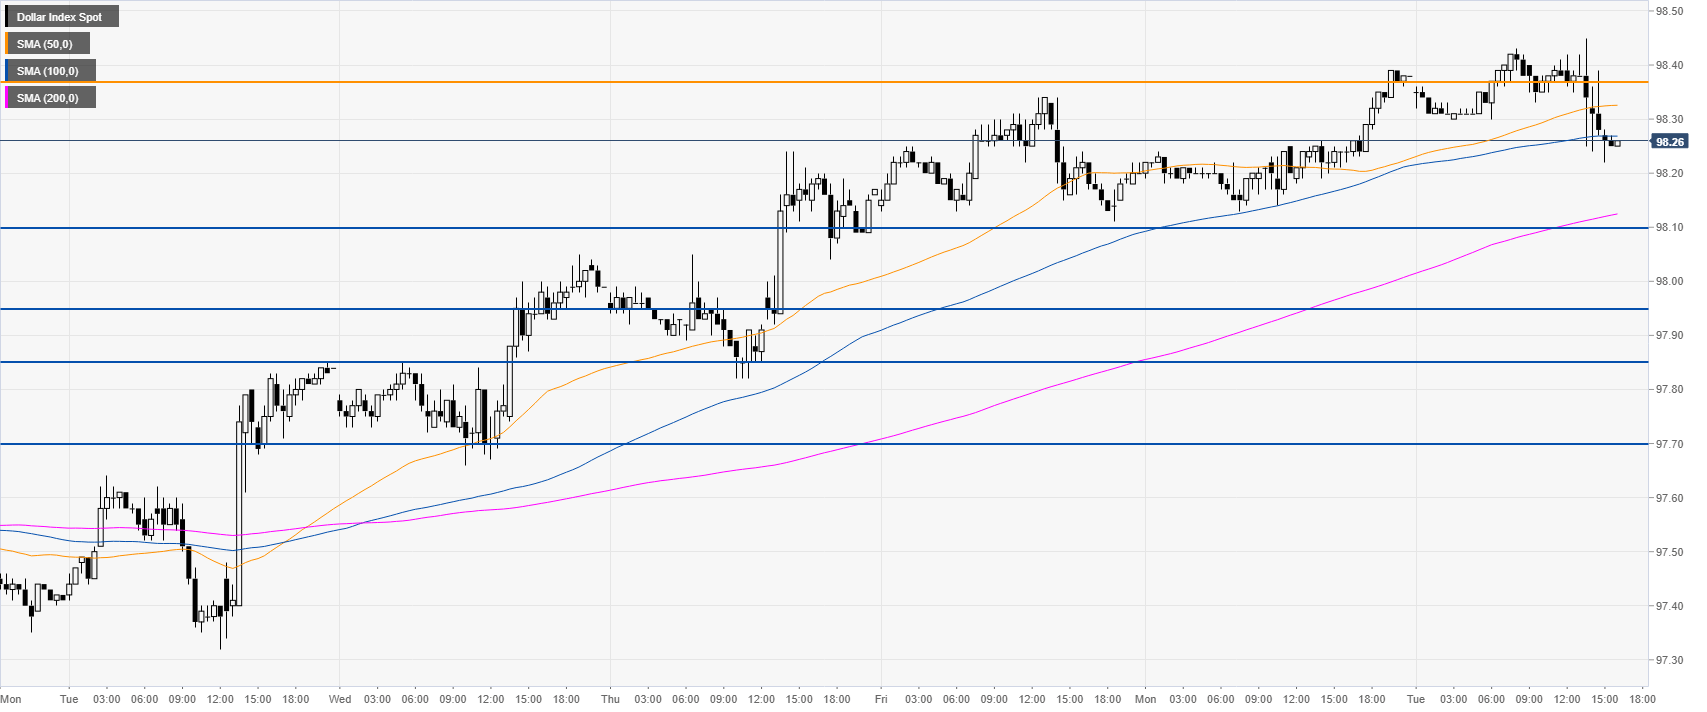
DXY 30-minute chart
The Greenback is trading above an upward sloping 200 SMA, suggesting bullish momentum in the short term. Immediate support could be found near the 98.10, 97.95 and 97.85 levels.
Additional key levels