9 Sep 2019
GBP/USD technical analysis: Cable clings to intraday gains near 1.2350 price level
- In the New York session, the Sterling is consolidating its intraday gains.
- Robust UK manufacturing and industrial data, as well as Brexit optimism bolstered the mood on the GBP.
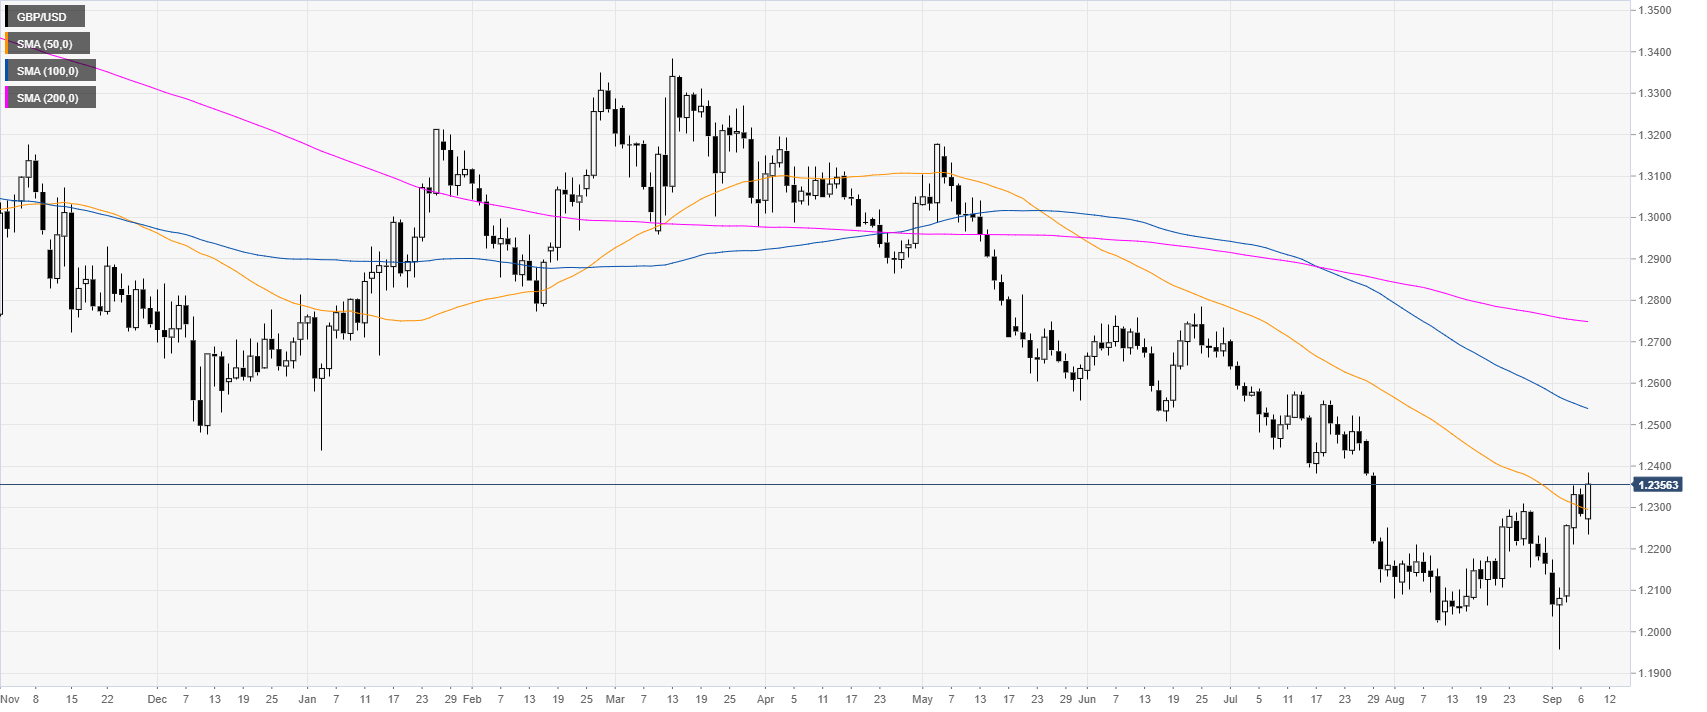
GBP/USD daily chart
GBP/USD is trading in a bear trend below the 100 and 200-day simple moving averages (SMAs). The market is attempting to create a double bottom as the Sterling is trading above the 1.2300 figure and the 50 SMA. Earlier in the London session, the Pound got boosted on better-than-expected UK manufacturing and industrial data as well as Brexit optimism.
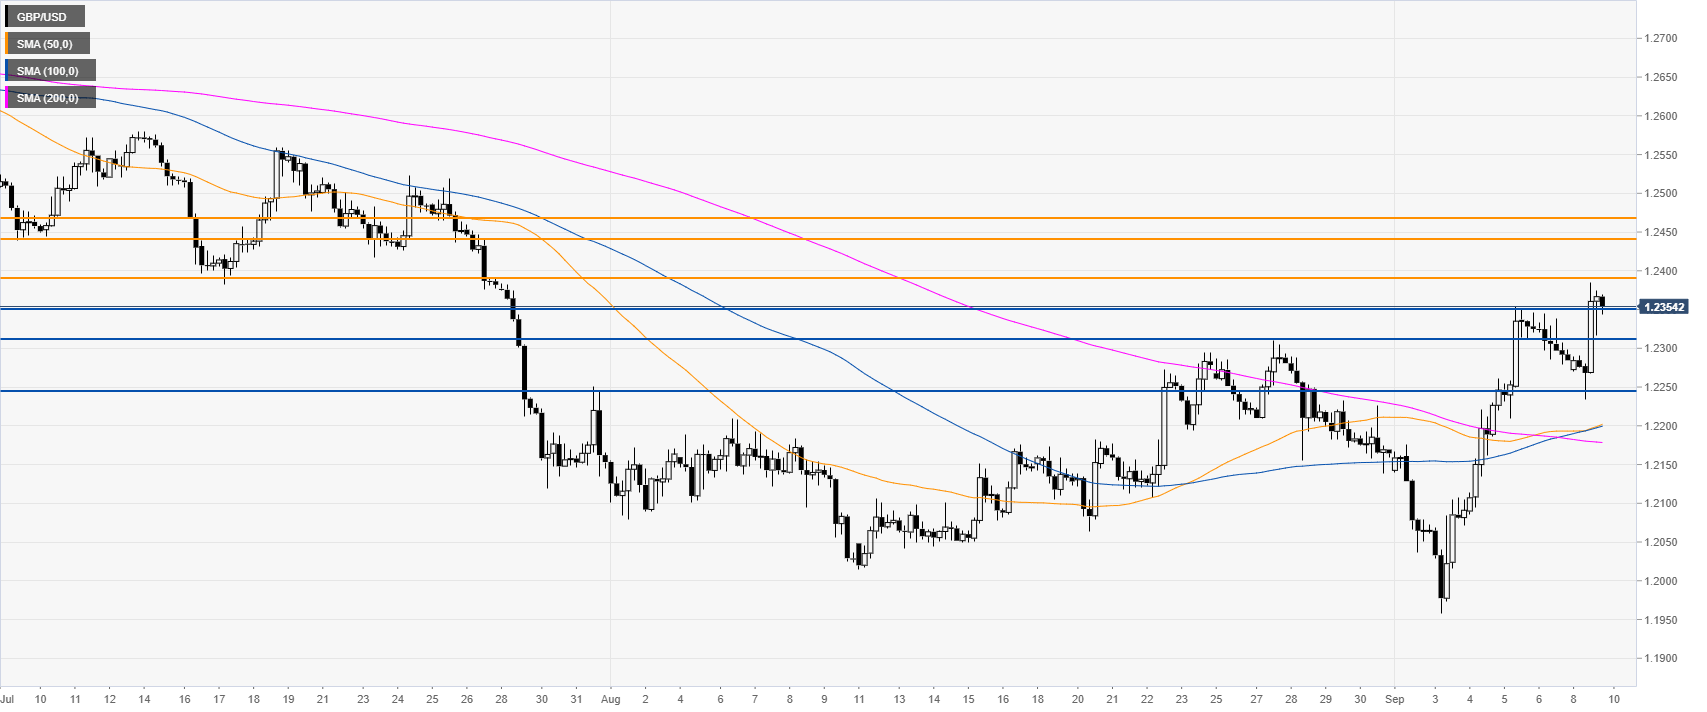
GBP/USD four-hour chart
GBP/USD is consolidating the intraday gains above last week’s high as the market is trading above its main SMAs. Bulls' objective is to climb above 1.2389. If the resistance is broken the next pit-stops on the way up can be 1.2441 and 1.2467 price levels, according to the Technical Confluences Indicator.
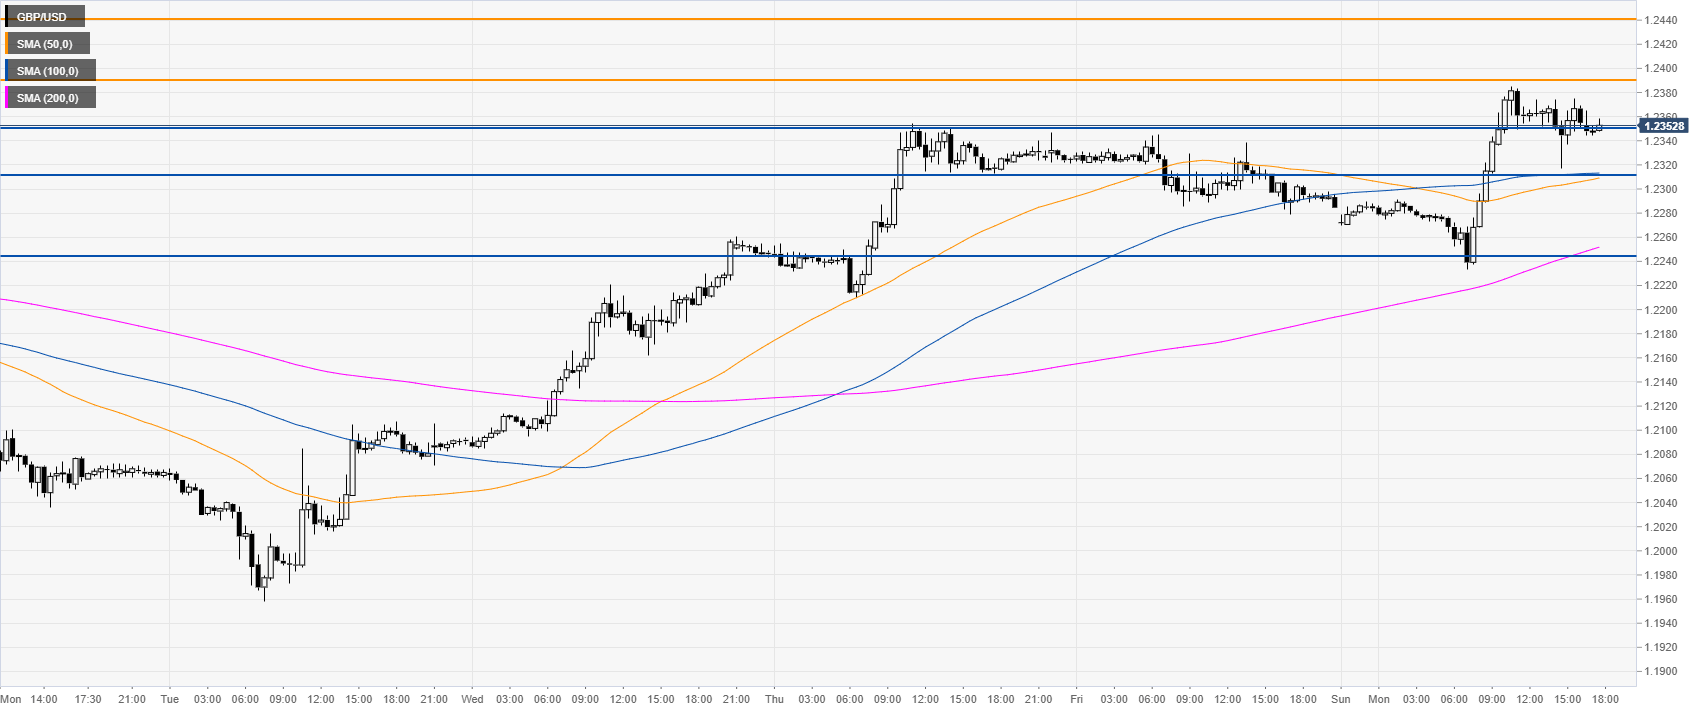
GBP/USD 30-minute chart
The Pound is trading above the main SMAs, suggesting bullish momentum in the near term. Bears need to reclaim the 1.2351/1.2312 support zone to create a more meaningful retracement towards 1.2245 support, according to the Technical Confluences Indicator.