13 Sep 2019
GBP/USD technical analysis: The Cable is clinging to multi-week tops, above 1.2460
- The Sterling bulls are keeping the pressure on into the end of the week.
- The level to beat for bulls is the 1.2464/77 resistance zone.
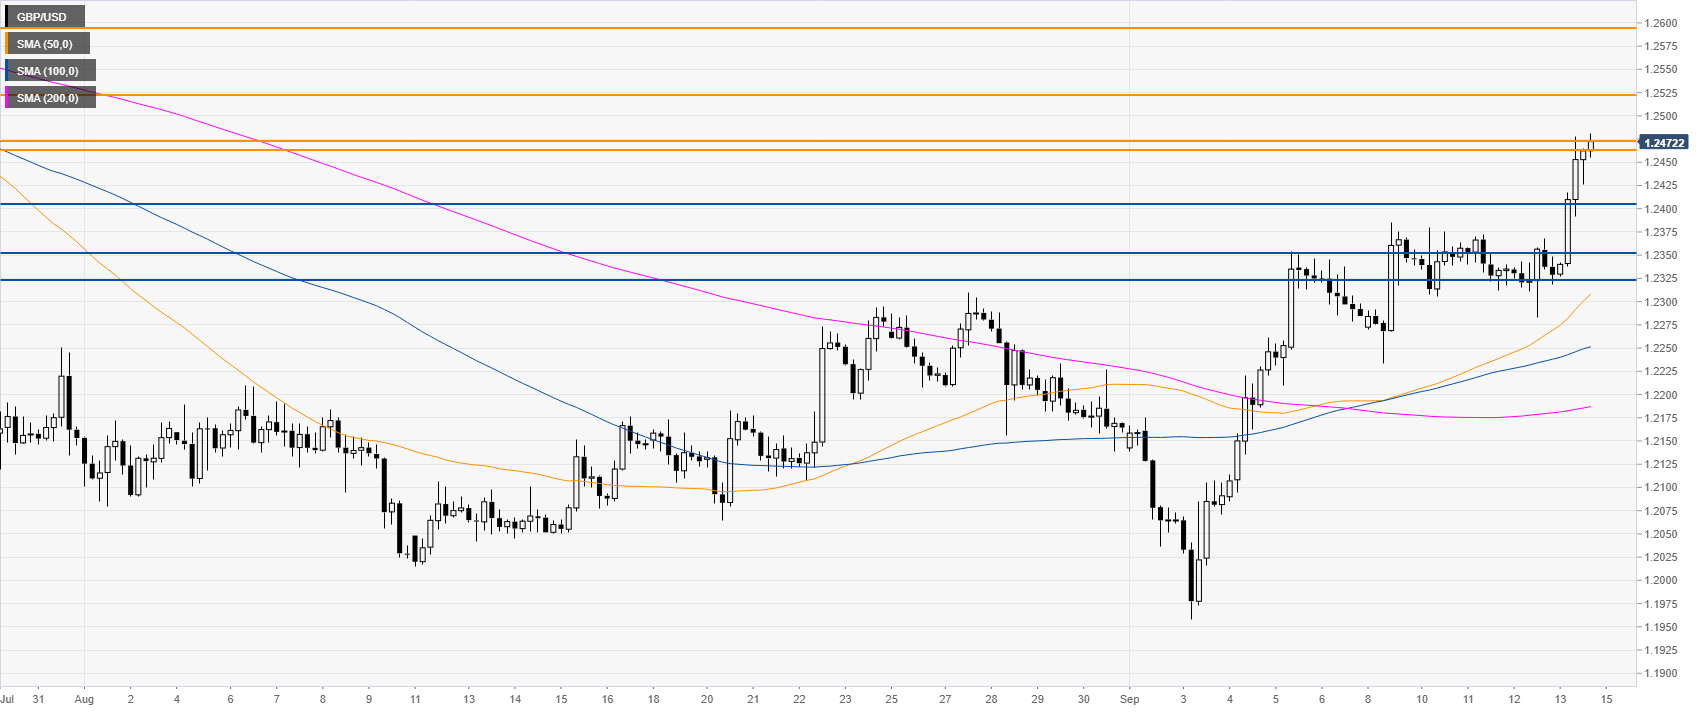
GBP/USD daily chart
The Pound is trading in a bear trend below the 100 and 200-day simple moving averages (SMAs). However, in August and September, the market has been rebounding sharply.

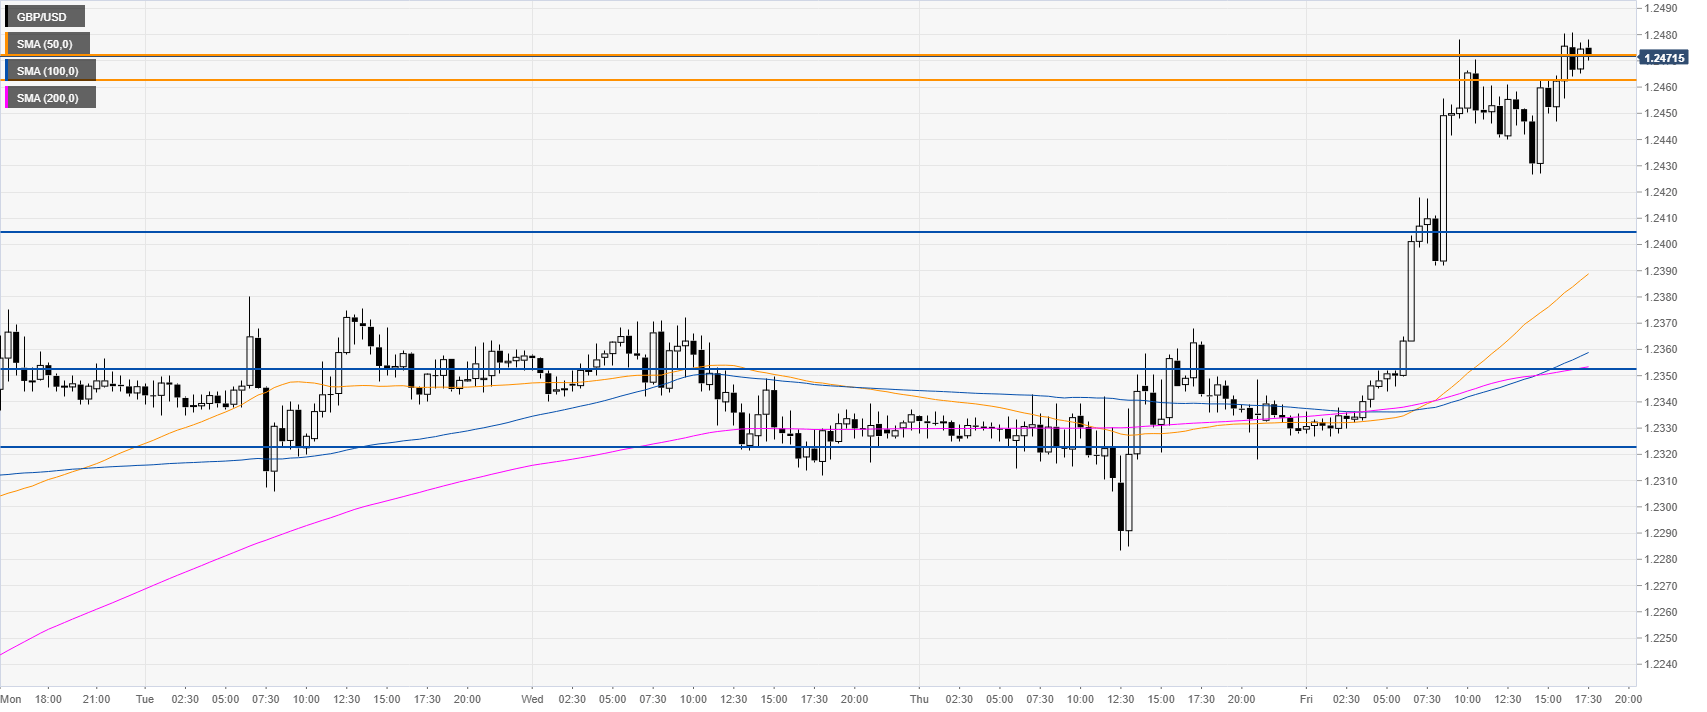
GBP/USD four-hour chart
The Sterling is trading well above the main SMAs as the market spiked up to the 1.2464/77 resistance zone. A break above this zone can open the doors for further continuation up towards 1.2520 and 1.2594 resistances, according to the Technical Confluences Indicator.
GBP/USD 30-minute chart
The Sterling is pressuring the weekly highs well above the main SMAs. Support is seen at 1.2405, 1.2355 and 1.2322, according to the Technical Confluences Indicator.
Additional key levels