27 Sep 2019
EUR/USD technical analysis: Fiber enters the Asian session near the 2019 lows
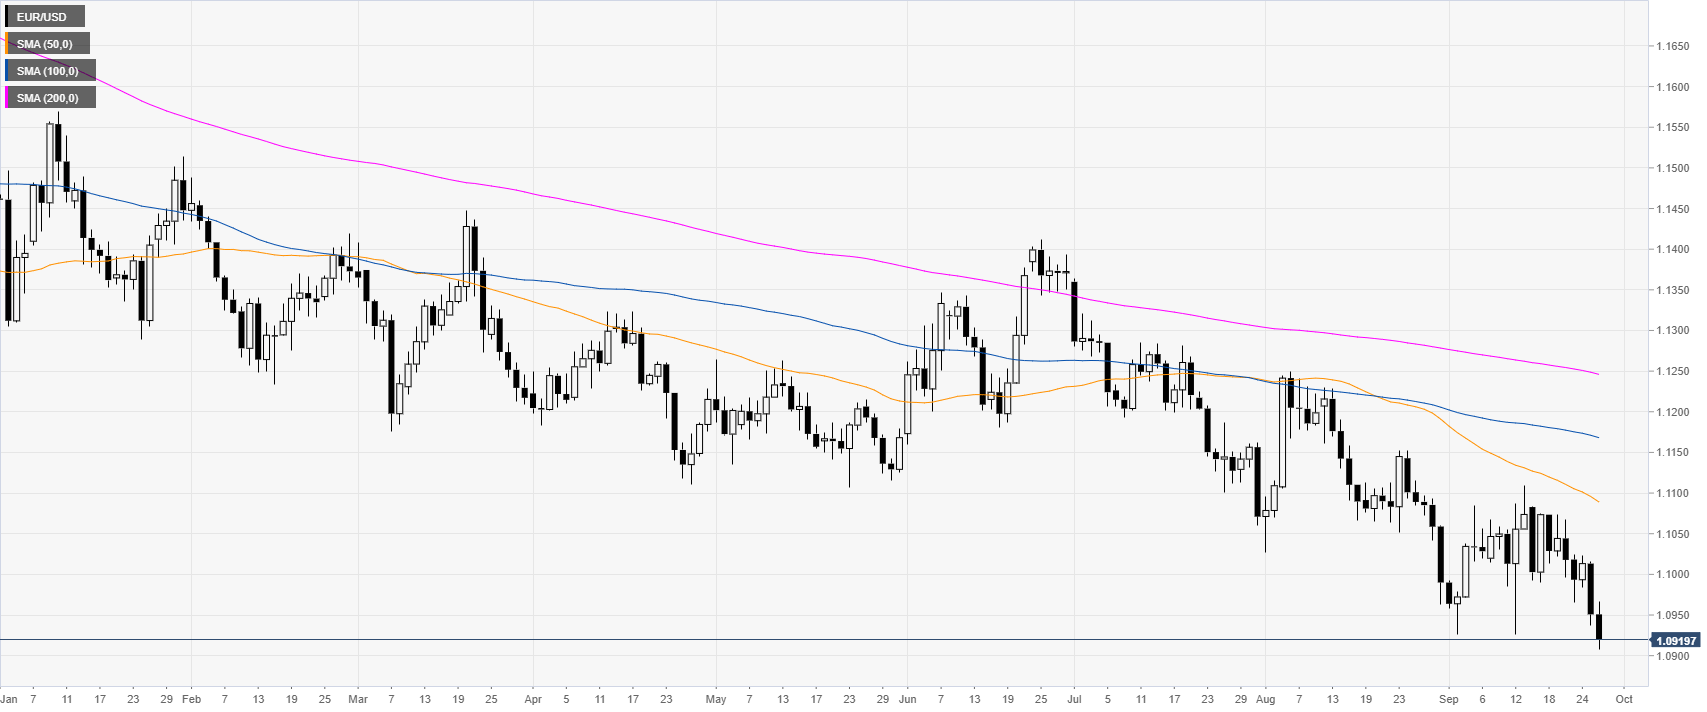
- EUR/USD printed fresh 2019 lows this Thursday, reaching the 1.0908 price level.
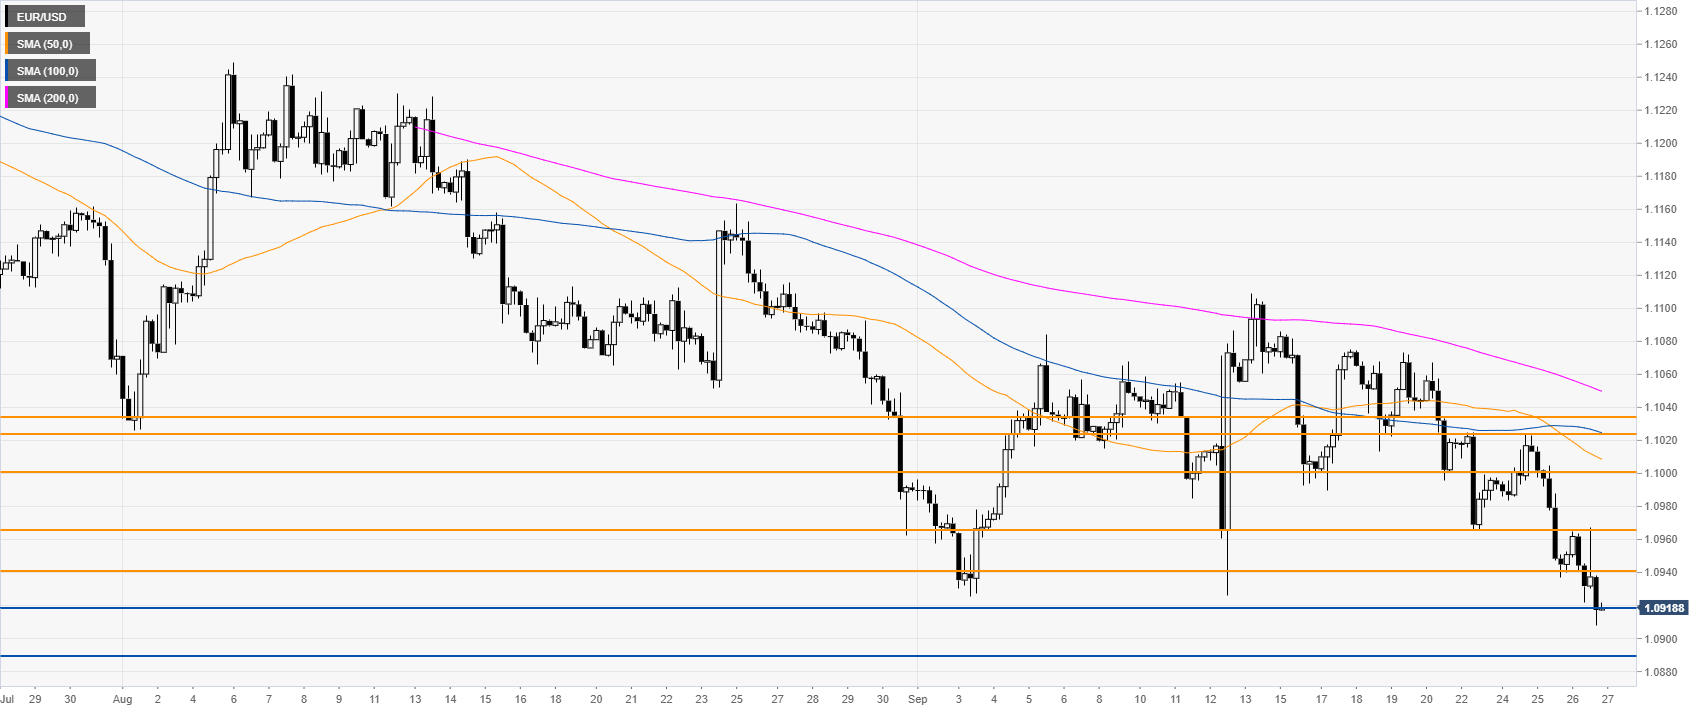
- The market is currently challenging the 1.0918 support.
EUR/USD daily chart
The common currency, on the daily chart, is trading in a bear trend below the main daily simple moving averages (DSMAs). In the New York session on Thursday, the US Gross Domestic Product came in at 2% in line with the market expecations.
EUR/USD four-hour chart
The market is trying to break below the 1.0918 support near the 2019 low currently at 1.0908. A break below 1.0908 can open the gates to a move down to the 1.0890 price level, according to the Technical Confluences Indicator.
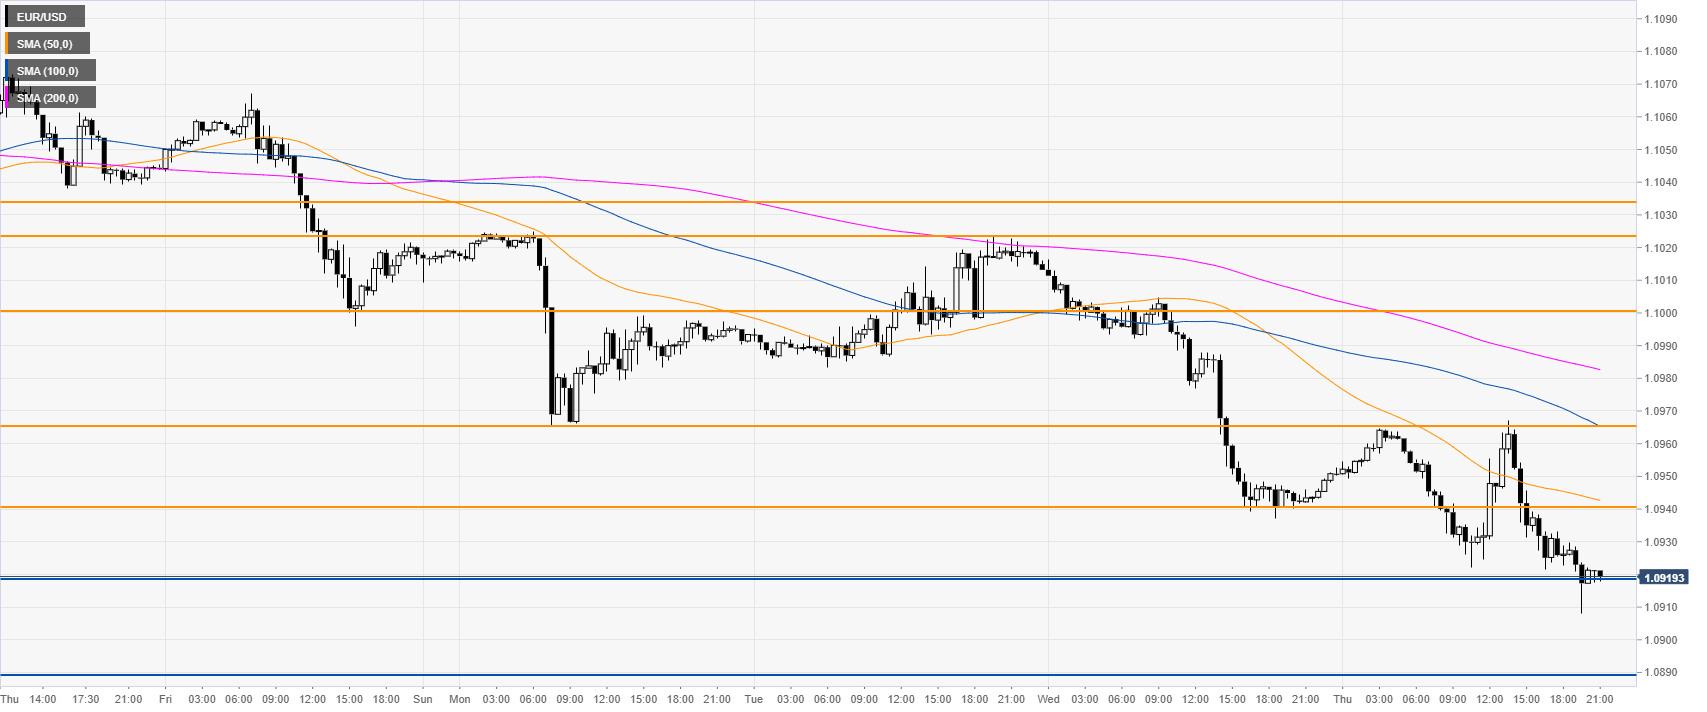
EUR/USD 30-minute chart
EUR/USD is trading below the main SMAs, suggesting a bearish bias in the near term. Immediate resistance is seen at the 1.0940 and 1.0966 levels and the 1.1000 figure, according to the Technical Confluences Indicator.
Additional key levels