4 Oct 2019
USD/CHF technical analysis: Downside limited by short-term rising trendline, 0.9937/35 confluence
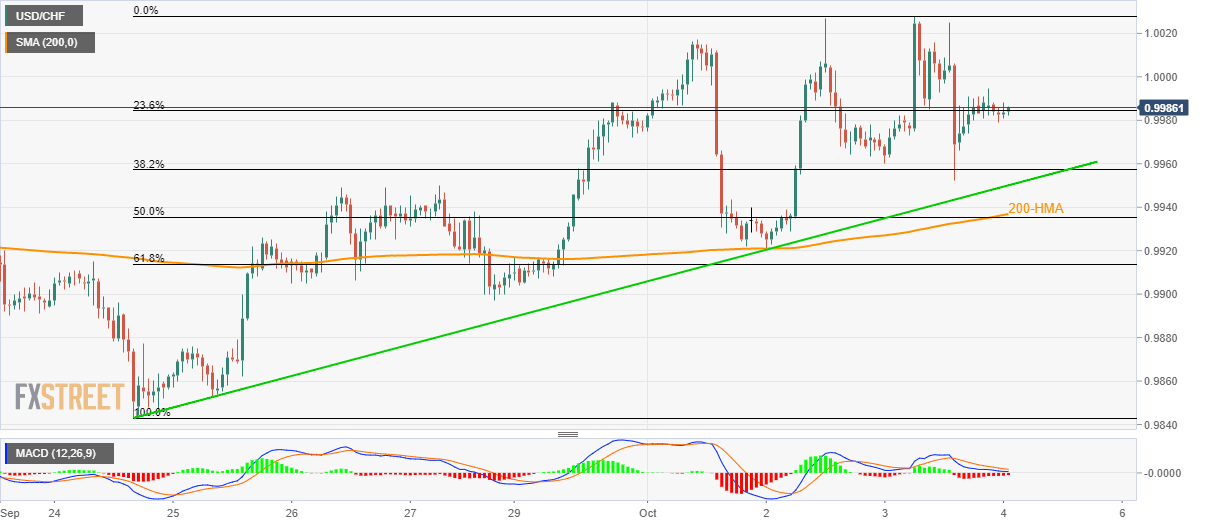
- USD/CHF seesaws around 23.6% Fibonacci retracement after witnessing multiple failures to cross 1.0030.
- A nine-day-old rising trend-line, followed by a confluence of 200-HMA/50% Fibonacci retracement limits near-term declines.
Despite witnessing pullbacks from 1.0030, USD/CHF is yet to slip beneath key supports as it clings to 0.9985 during early Friday.
The pair seesaws near 23.6% Fibonacci retracement of its upswing from last Tuesday and can revisit 38.2% Fibonacci retracement level surrounding 0.9960 during further declines.
However, an upward sloping trend-line since September 24, at 0.9950, followed by a 200-hour simple moving average (HMA) and 50% Fibonacci retracement, near 0.9937/35, could question pair’s further south-run.
Should there be increased downside pressure below 0.9935, September 27 low close to 0.9900 will be sellers’ choice.
Meanwhile, pair’s successful rise above 1.0030 could propel it to the late-May top adjacent to 1.0100.
USD/CHF hourly chart
Trend: bullish