7 Oct 2019
US Dollar Index Technical Analysis: The bullish view remains intact above the 55-day SMA at 98.29
- DXY has so far met monthly support at 98.64 (October 3rd), coincident with the 21-day SMA.
- The continuation of the recovery could extend initially to 99.37 (early September peak) ahead of another test of the 2019 high near 99.70 (October 1st).
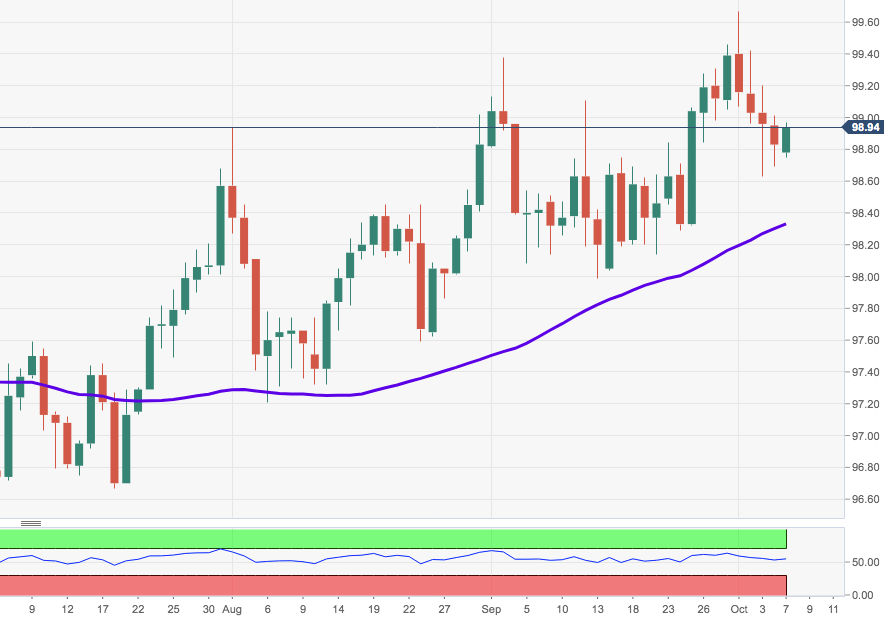
- In the meantime, the 55-day SMA at 98.29 keeps underpinning the immediate bullish view on the index.
DXY daily chart