7 Oct 2019
EUR/USD technical analysis: Fiber trading at daily highs just below the 1.1000 figure
- EUR/USD starts the week within familiar ranges below the 1.1000 handle.
- German Factory Orders declined by 0.6% monthly and 6.7% yearly in August.
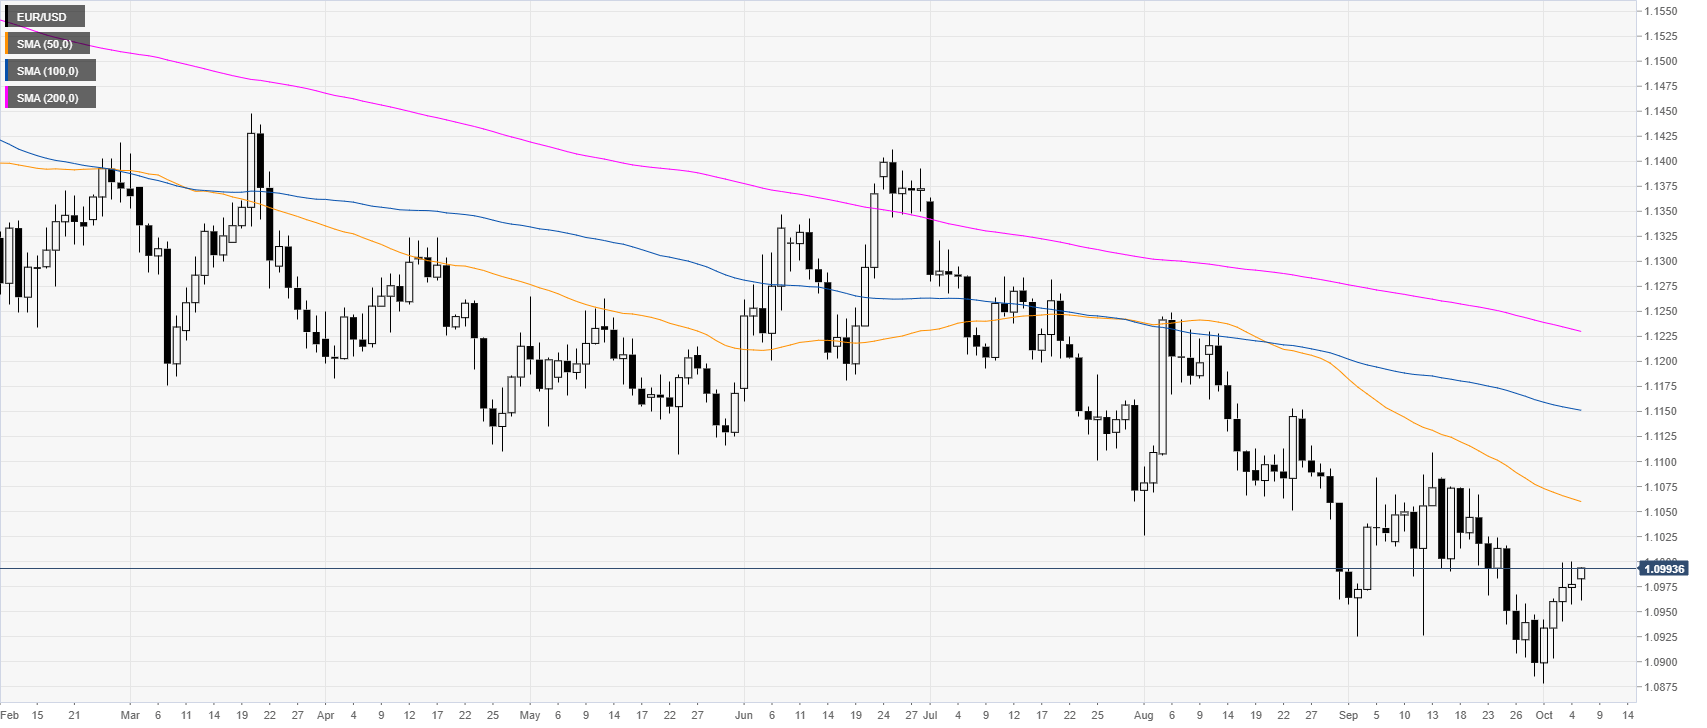
EUR/USD daily chart
On the daily chart, the common currency is trading in a bear trend below the main daily simple moving averages (DSMAs). Earlier in the European session, the Factory Orders in Germany declined by 0.6% monthly and 6.7% yearly in August.
EUR/USD four-hour chart
The market is starting the week within the 1.0960 and 1.1000 range. A break above 1.1000 is needed for the spot to move up towards the 1.1025/43 resistances, according to the Technical Confluences Indicator.

EUR/USD 30-minute chart
EUR/USD is trading above the main SMAs, suggesting a bullish bias in the near term. Immediate support is seen at the 1.0975 and 1.0960/40 price levels. Further down lie the 1.10890 support, according to the Technical Confluences Indicator.

Additional key levels