WTI technical analysis: 50% Fibo of major range capps advances, eyes on a test below $50 handle
- The price of oil is deteriorating, clearly seen as so using the GMMAs which fan out in a bearish direction.
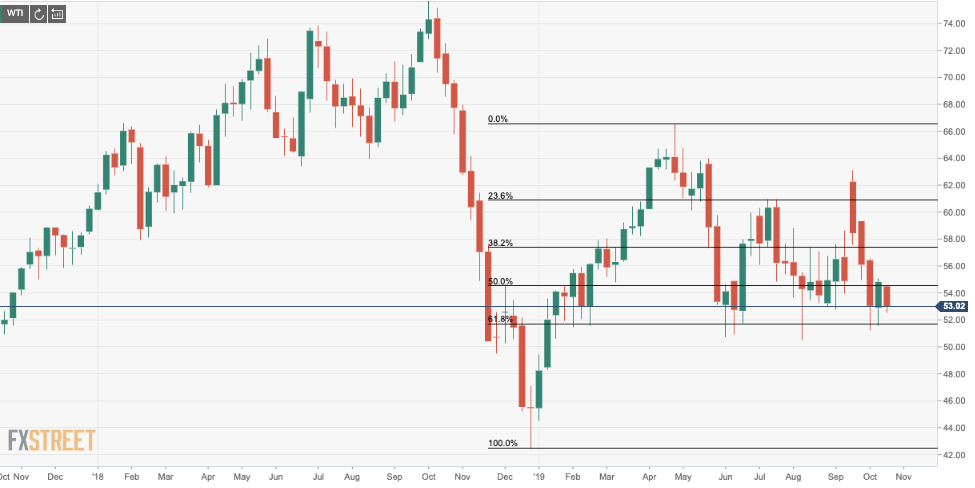
- WTI trades below the 21-DMA and is capped by the 50% Fibonacci retracement of the Dec 2018 swing lows to YTD swing highs.
The black gold has extended losses below the 50 and 21-day moving averages converging at 53.70. Bullish attempts have been faded of late at the 50% Fibonacci retracement of the Dec 2018 swing lows to YTD swing highs and remains directly offered below the 200-DMA confluence with the 38% Fibo of the same rage.
While maintaining a handle above 50, there are still bearish tendencies at this juncture as the daily GMMAs show, with the short-term moving average spreading wider below the longer-term moving averages, also spreading in a bearish direction. Bears can now look to close below the 50 handle with eyes set on the Nov 2018 lows at 49.39 again. Further down, the 18th Dec lows down at 45.77 ahead of the Dec double bottom lows below 42.50 come into focus.
Weekly chart