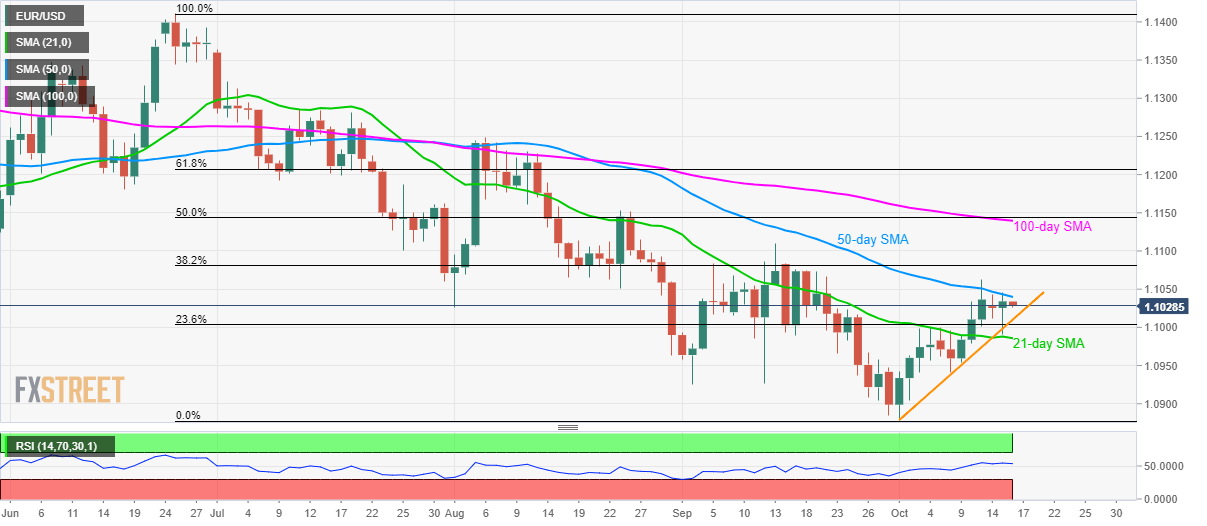
EUR/USD technical analysis: Lack of momentum between 21/50-day SMA
- EUR/USD registers another failure to cross 50-day SMA.
- The two-week-old rising trend line, 21-day SMA limits immediate declines.
- RSI seesaws inside the normal territory.
With its another failure to rise past-50-day Simple Moving Average (SMA), EUR/USD declines to 1.1030 during early Wednesday.
The quote now aims to revisit an upward sloping support line since the month’s start, at 1.1010. Though, the pair’s further downside could be limited by 21-day SMA level of 1.0985.
In a case where bears refrain from respecting short-term moving average, 1.0930/25 and monthly bottom surrounding 1.0880 could flash on their radars.
Alternatively, the pair’s successful run-up beyond 50-day SMA level of 1.1040 can escalate the recovery towards 38.2% Fibonacci retracement of June-September downside, at 1.1080.
However, 1.1140/45 region encompassing 100-day SMA and 50% Fibonacci retracement could keep buyers troubled during the quote’s rise above 1.1080.
It should also be noted that 14-bar Relative Strength Index (RSI) stays inside normal territory between 70 and 30 levels, which in turn signals continuation of the present trading pattern.
EUR/USD daily chart
Trend: pullback expected