16 Oct 2019
US Dollar Index Technical Analysis: DXY remains under pressure. Risks a break below 98.00
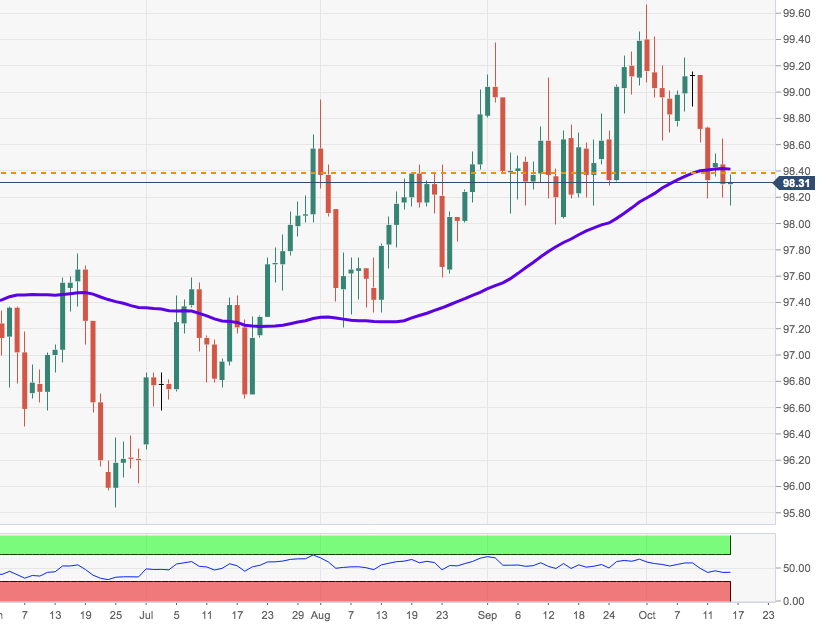
- DXY is now attempting a sideline pattern in the lower end of the recent range around the 55-day SMA in the 98.30 region. This area also coincides with the May top at 98.37.
- The correction lower still looks well in place in the near term and the Greenback risks a potential move to, initially, the 98.00 level ahead of the Fibo retracement at 97.87, which should hold the downside.
- Occasional rebounds face the initial barrier at the 21-day SMA at 98.78 ahead of last week’s top at 99.25.
DXY daily chart