16 Oct 2019
GBP/USD technical analysis: Cable easing from daily highs, trading near 1.2800 handle
- GBP/USD is back to 1.2800 after jumping to 1.2500 earlier in the New York session.
- The bull trend remains intact above the 1.2600 figure.
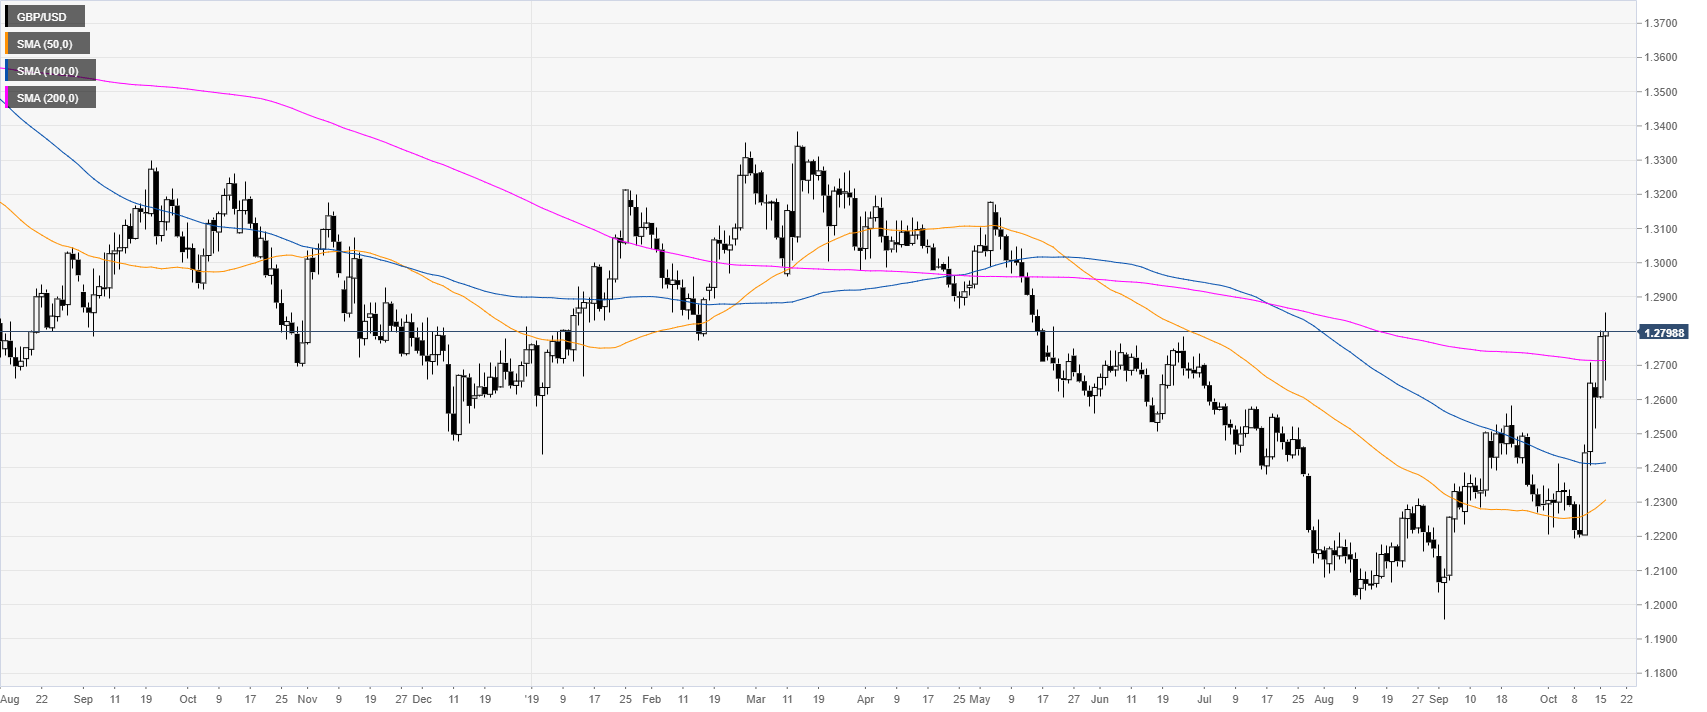
GBP/USD daily chart
The Pound, on the daily chart, is trading above the 200-day simple moving average (DSMA). Earlier in the New York session, GBP/USD leaped above 1.2800 as DUP (Democratic Unionist Party) reportedly accepted Brexit proposals on consent.
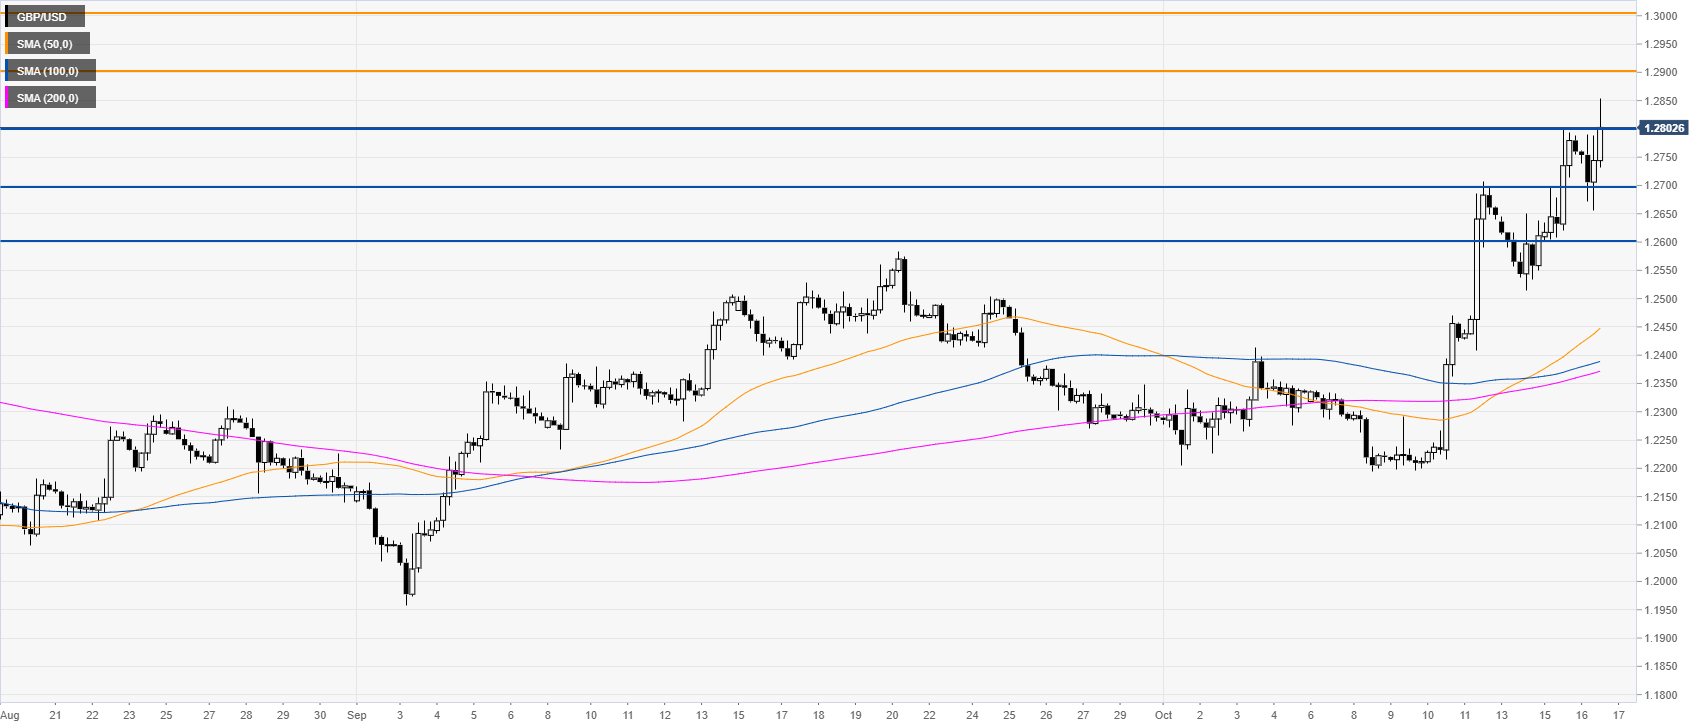
GBP/USD four-hour chart
GBP/USD is easing from the daily highs, now battling with the 1.2800 handle while trading above the main SMAs. If bulls keep the pressure, the next main resistances can be seen at the 1.2900 and 1.3000 figures.
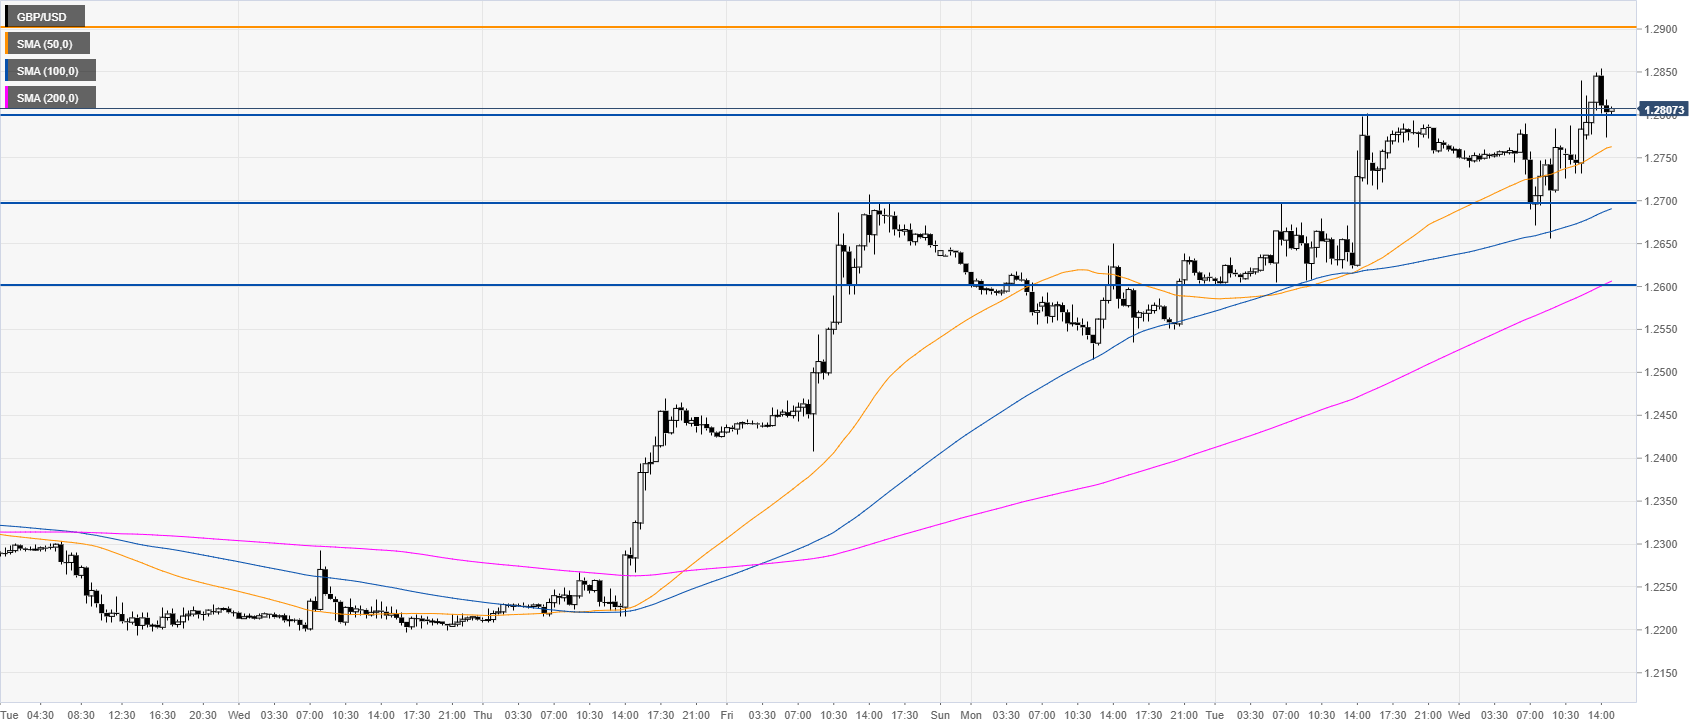
GBP/USD 30-minute chart
GBP/USD is trading above the main SMAs, suggesting bullish momentum in the near term. Support is at the 1.2800 and 1.2700 figure, according to the Technical Confluences Indicator. A daily close below the 1.2600 figure could switch the bias to bearish.
Additional key levels