22 Oct 2019
AUD/USD technical analysis: Aussie enters the Asian session above the 0.6850 level
- The Aussie is nearing the September highs this Monday.
- The level to beat for bulls is the 0.6872 level.
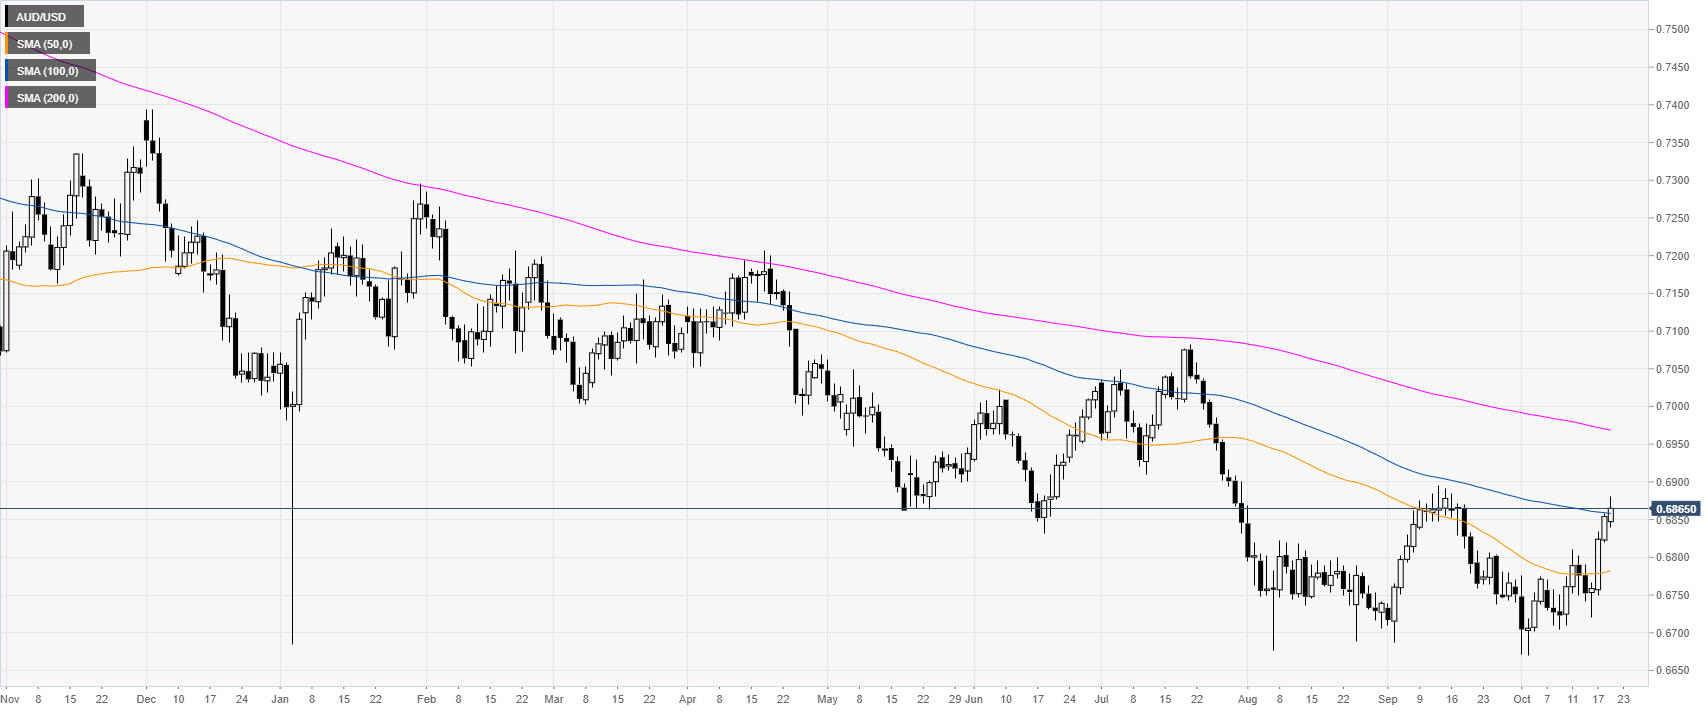
AUD/USD daily chart
The Aussie is trading in a downtrend below its 200-day simple moving averages (DSMAs) on the daily chart. However, in October, the market has been bouncing sharply and surpassed the 100 SMA at 0.6858.
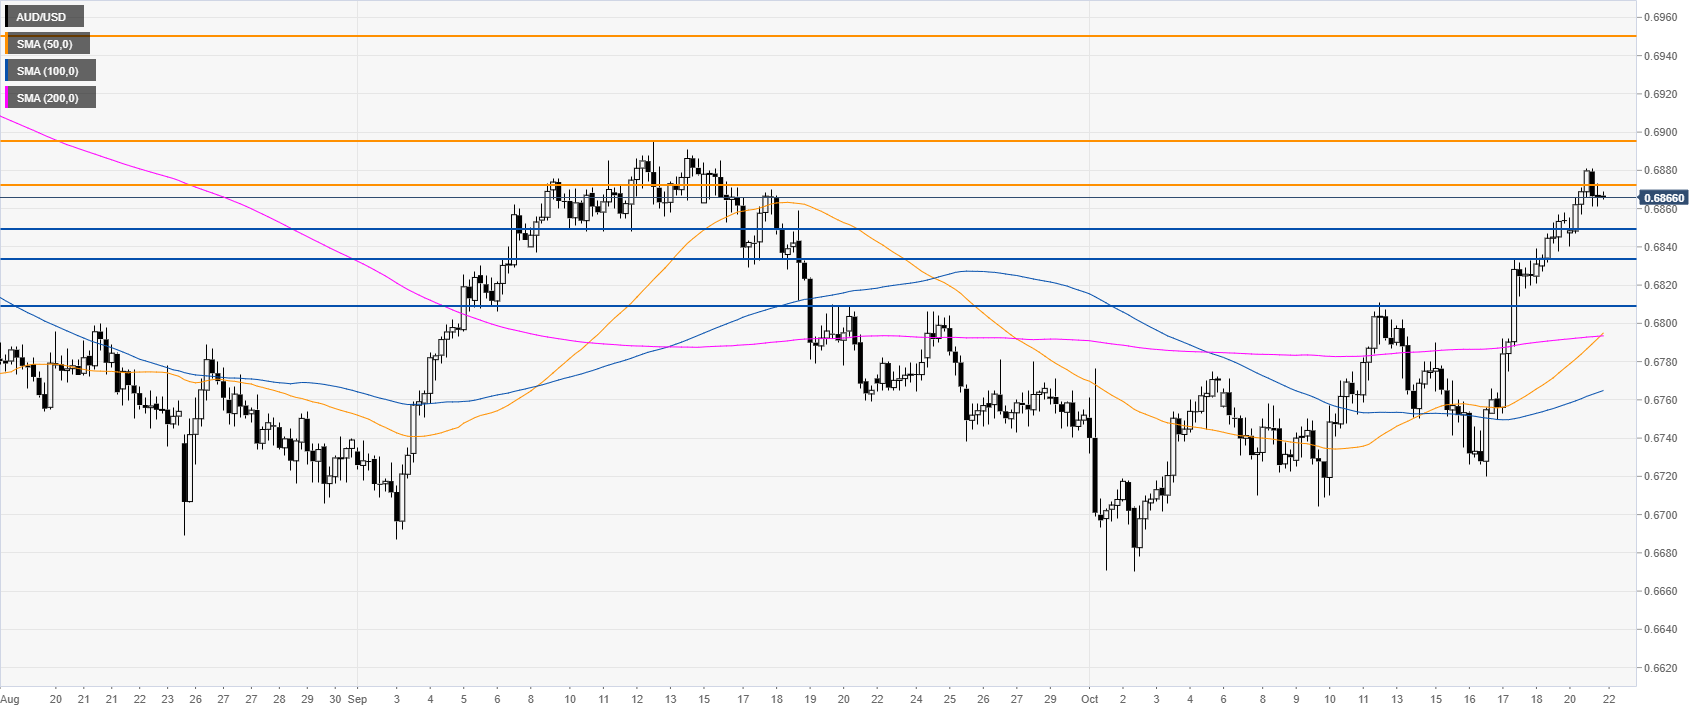
AUD/USD 4-hour chart
The market is trading above the main SMAs, suggesting a bullish momentum in the medium term. The level to beat for bulls is the 0.6872 resistance. A break above the level is necessary for the market to trade towards 0.6895, near September highs. In case the market takes out the September highs, the next level to watch become the 0.6950 resistance, according to the Technical Confluences Indicator.
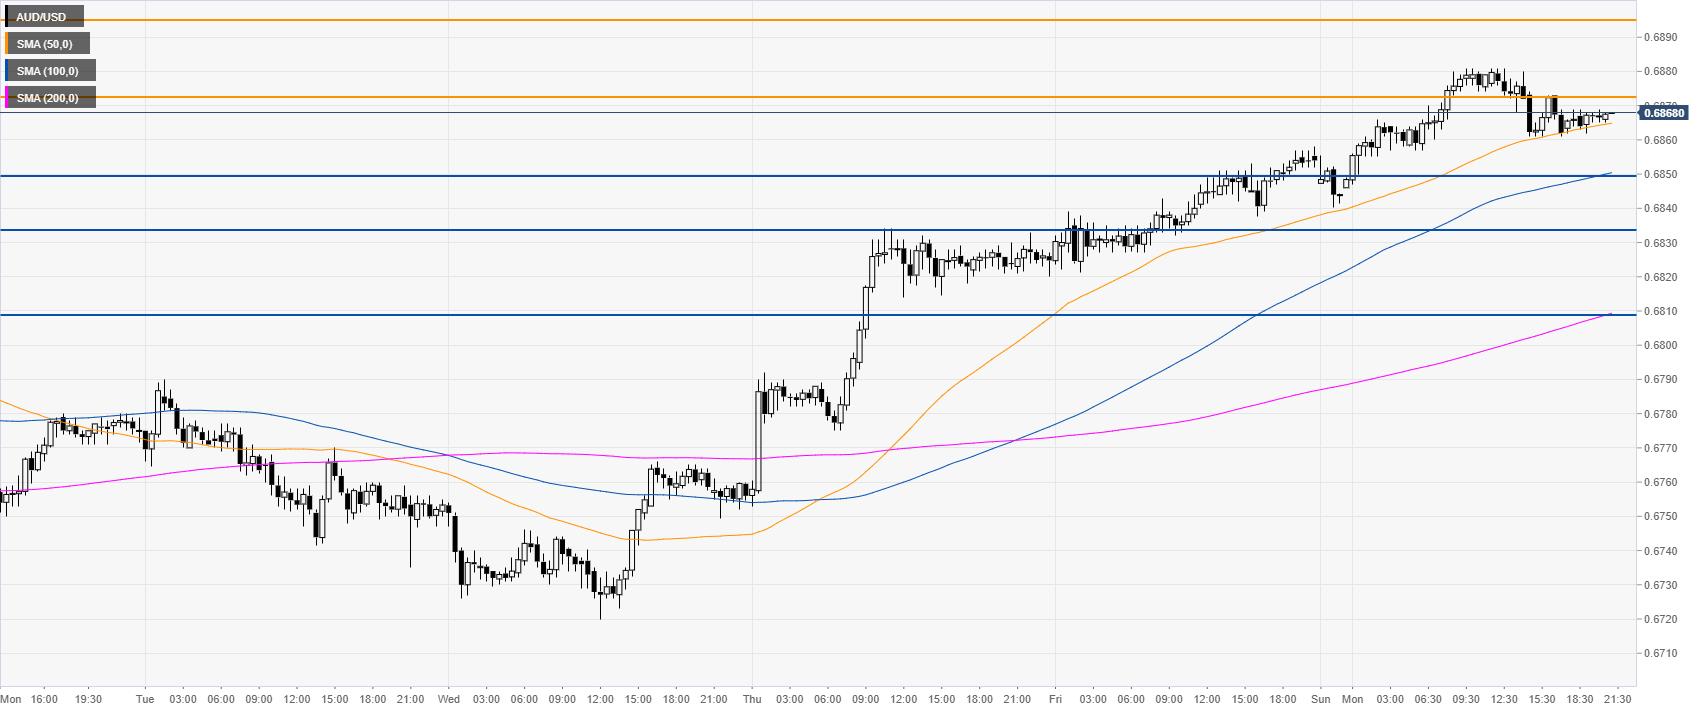
AUD/USD 30-minute chart
AUD/USD is trading above its main SMAs on the 30-minute chart, suggesting a bullish bias in the near term. Support is seen at the 0.6850, 0.6835 and 0.6807 price levels.
Additional key levels