1 Nov 2019
GBP/USD technical analysis: Cable is hanging near multi-month highs near 1.2950
- GBP/USD is trading mixed in the Friday’s New York session hovering near multi-month highs.
- The level to beat for bulls is the 1.2989 resistance.
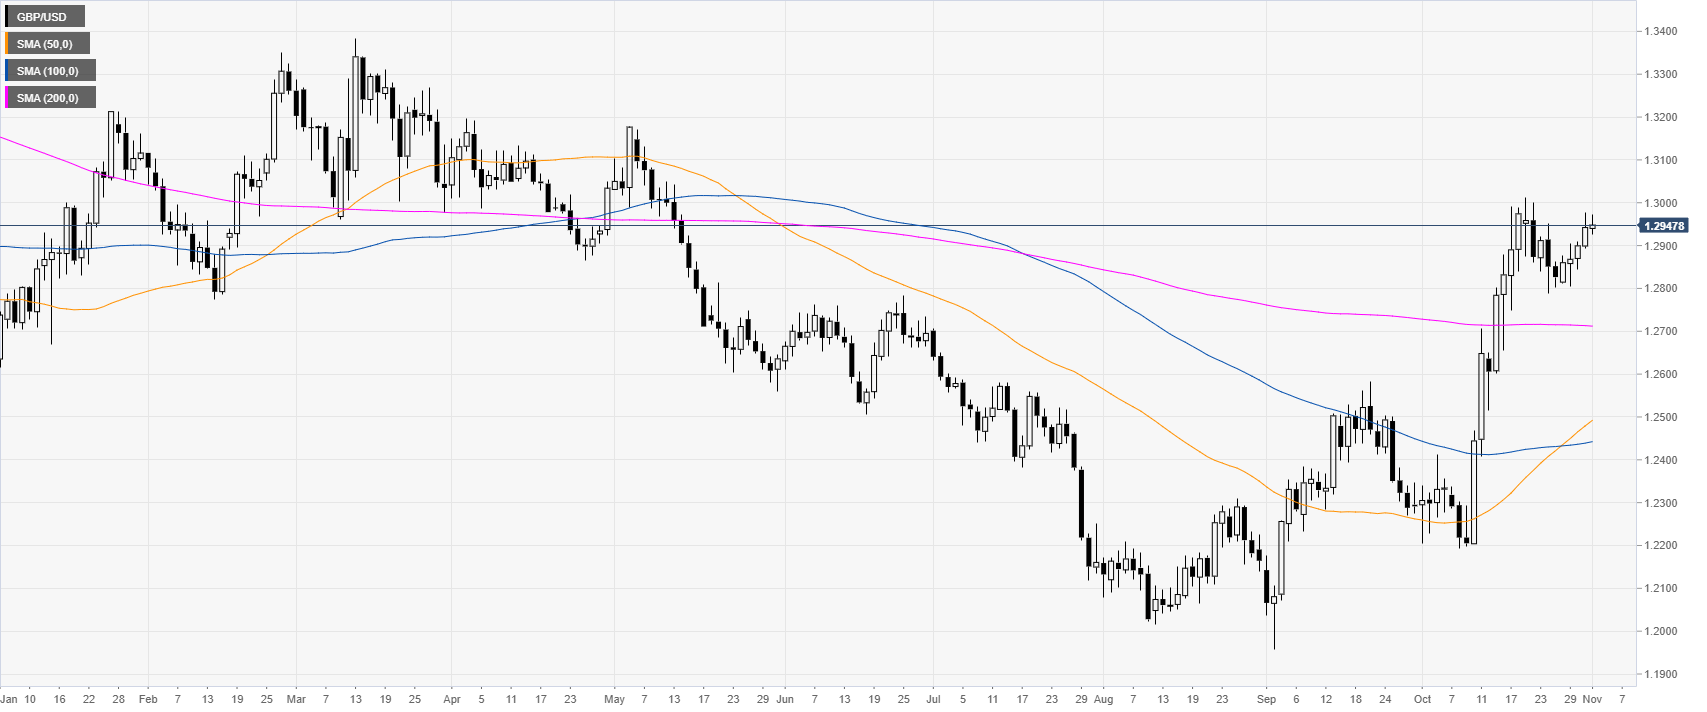
GBP/USD daily chart
GBP/USD in October jumped above its main daily simple moving averages (DMAs) and hit levels not seen since mid-May 2019. Buyers want a conclusive break above the 1.3000 handle and the October high at the 1.3013 level.
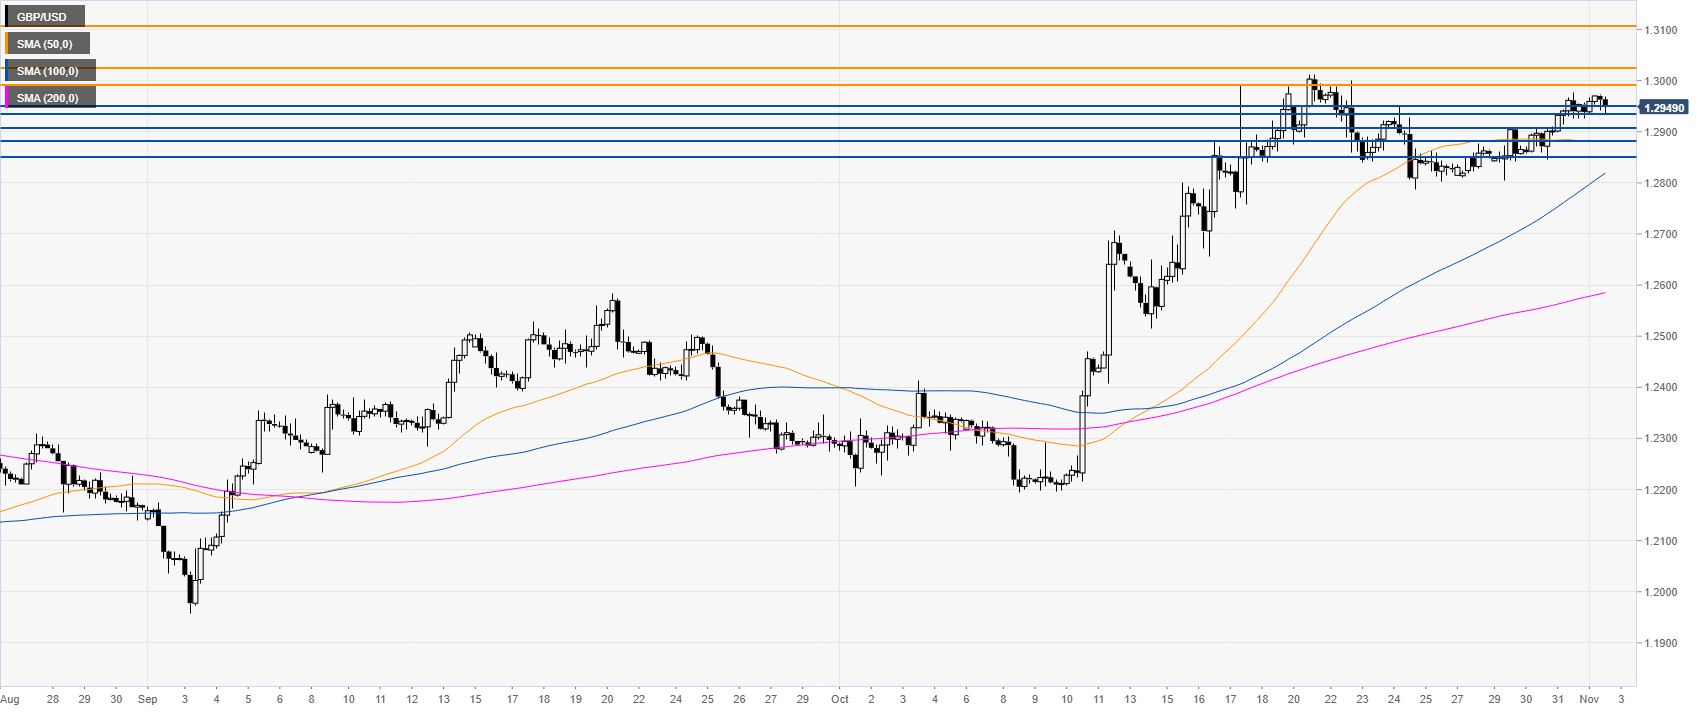
GBP/USD four-hour chart
GBP/USD is trading above the 1.2900 handle and the main SMAs on the four-hour chart, suggesting a bullish bias in the medium term. Buyers need to break the 1.2989 resistance to open the gates to more gains towards the 1.3024 level and the 1.3100 handle.
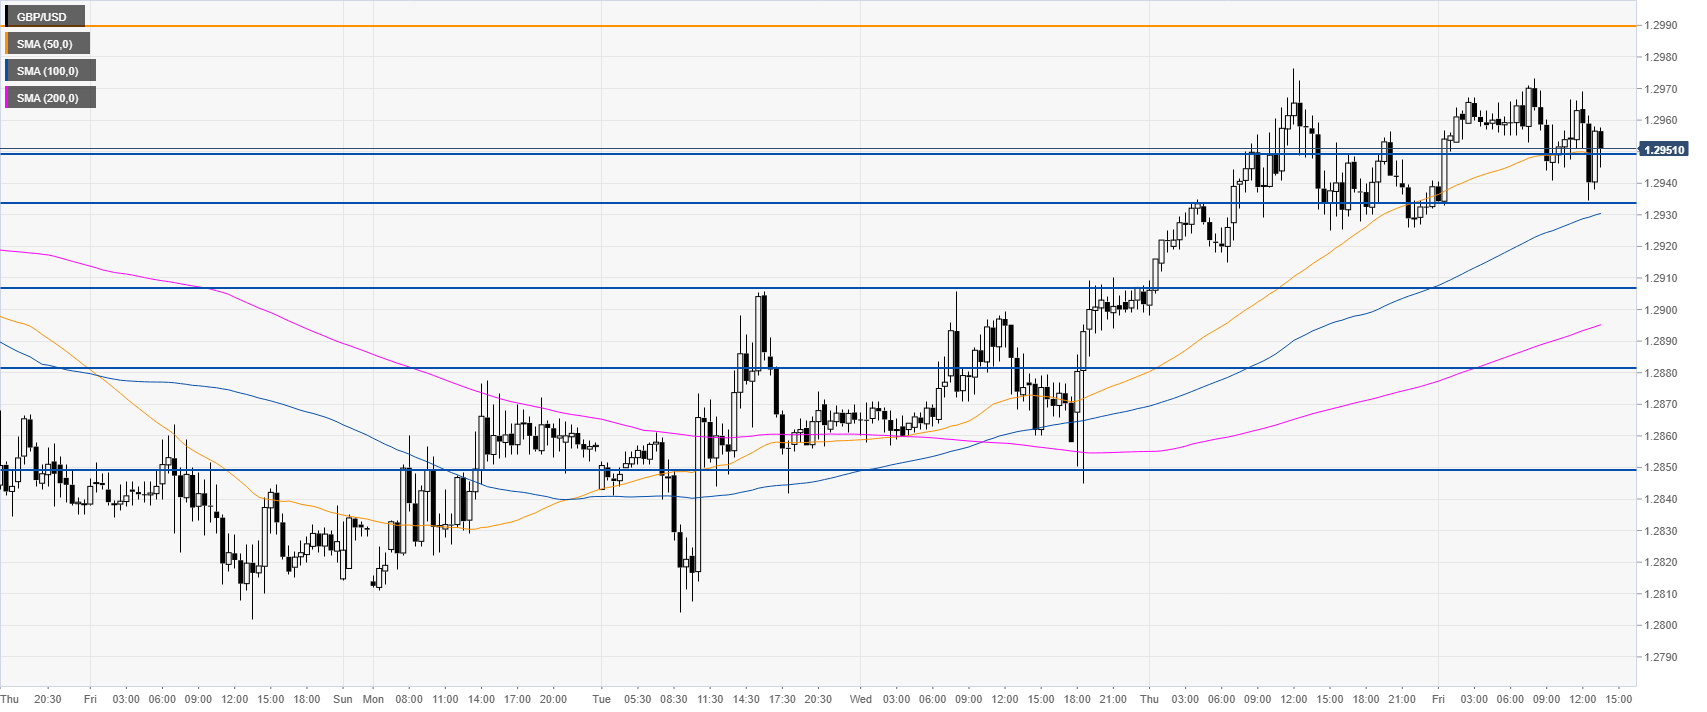
GBP/USD 30-minute chart
Sterling/Dollar is trading above its main SMAs, suggesting a bullish bias in the near term. Support is seen at 1.2950, 1.2934 and 1.2907 levels, according to the Technical Confluences Indicator.
Additional key levels