1 Nov 2019
EUR/USD technical analysis: Fiber trading in a triangle
- The Euro is hanging at daily highs after the London close on Friday.
- A bull breakout above the 1.1165 resistance could open the doors to further gains towards the 1.1200 handle.
- EUR/USD might be trading in an ascending triangle.
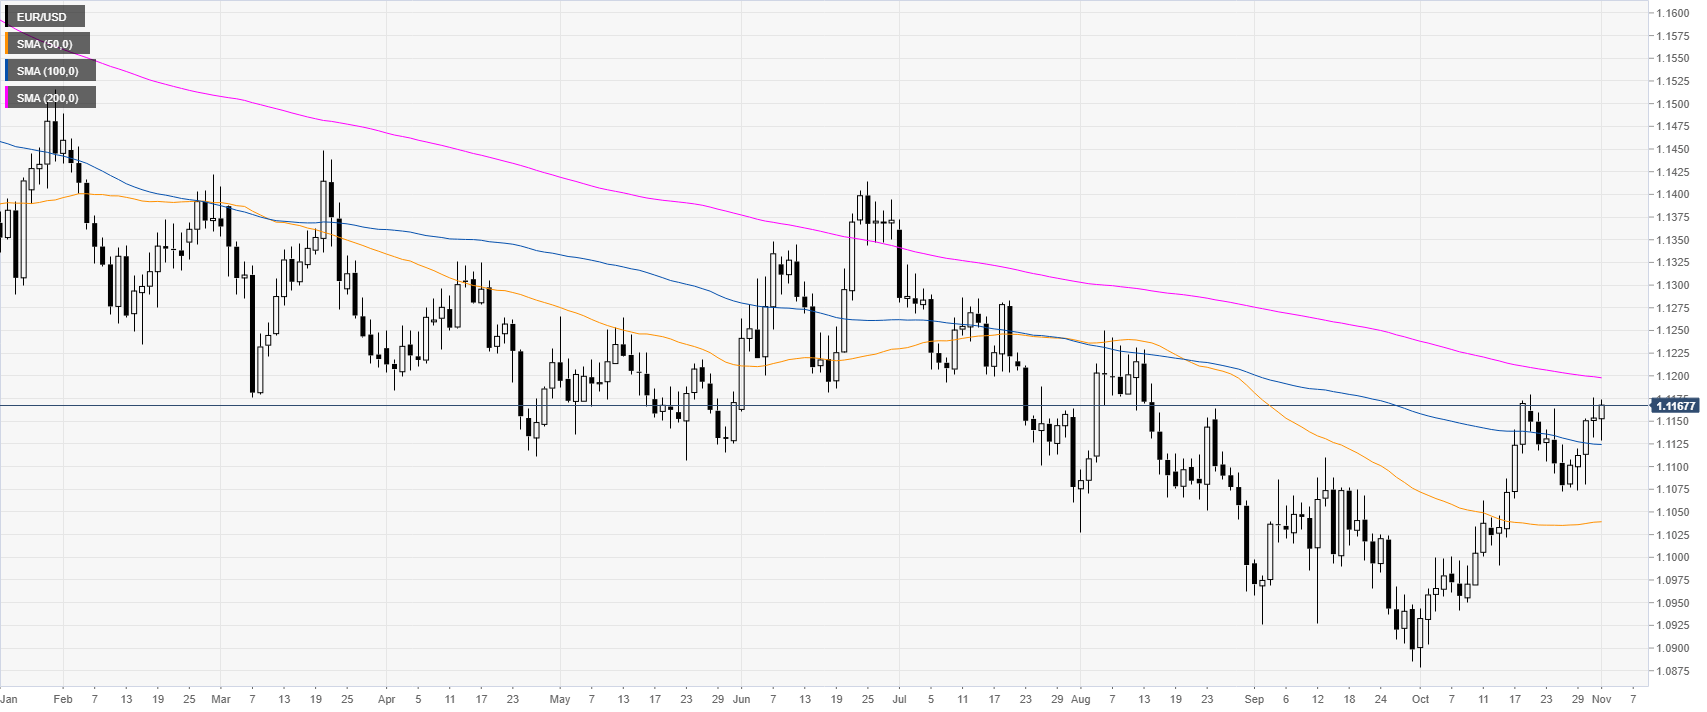
EUR/USD daily chart
On the daily chart, the Euro is trading in a bear trend below its 200-day simple moving average (DMA). This Friday, the spot is pressuring the October highs near 1.1179 level.
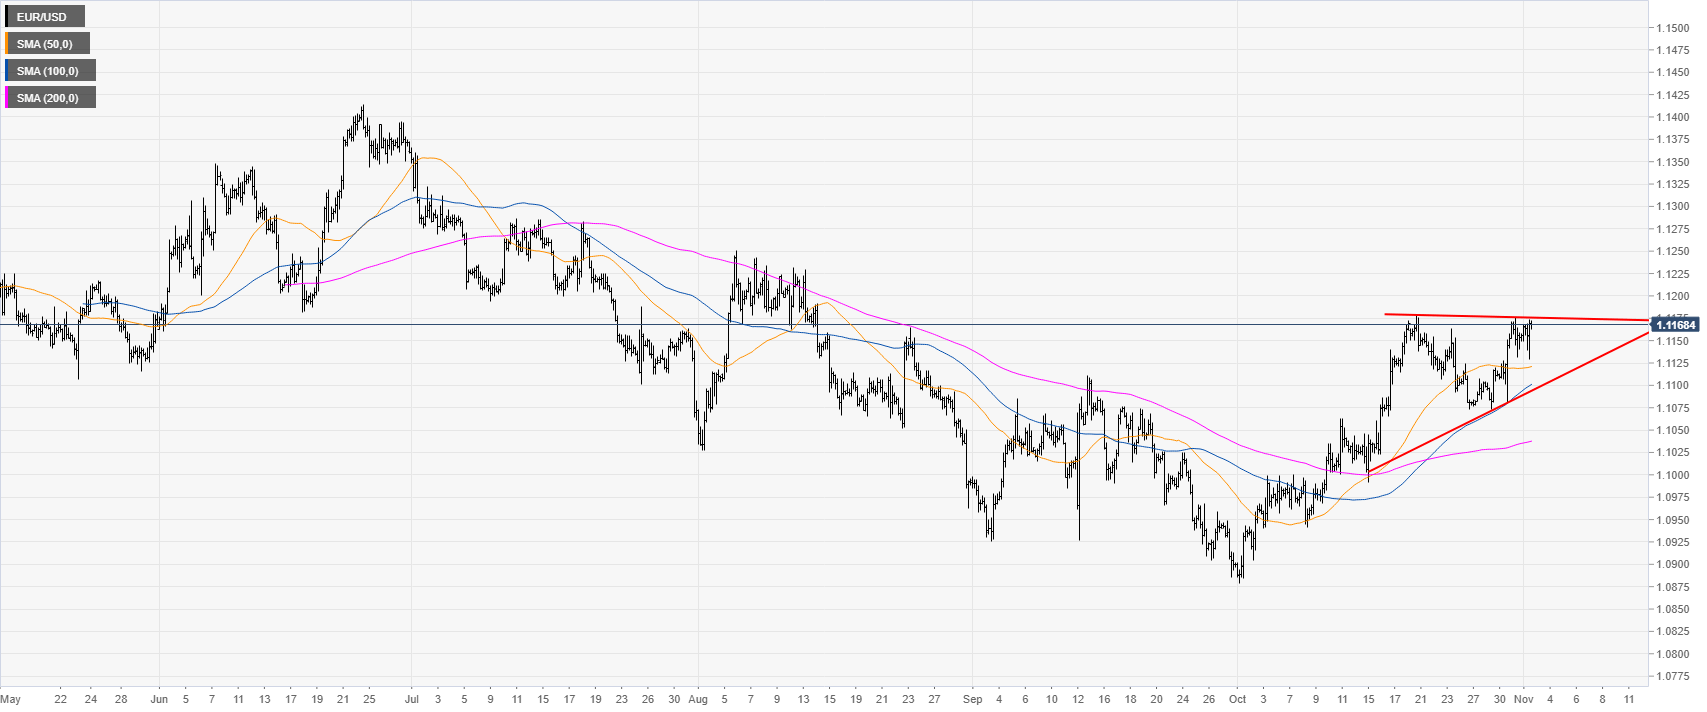
EUR/USD four-hour chart
EUR/USD, on the four-hour chart, might be forming an ascending triangle pattern. Next week if the market break to the upside, the spot could reach the 1.1181/1.1193, 1.1220 and 1.1255 resistances on the way up, according to the Technical Confluences Indicator.
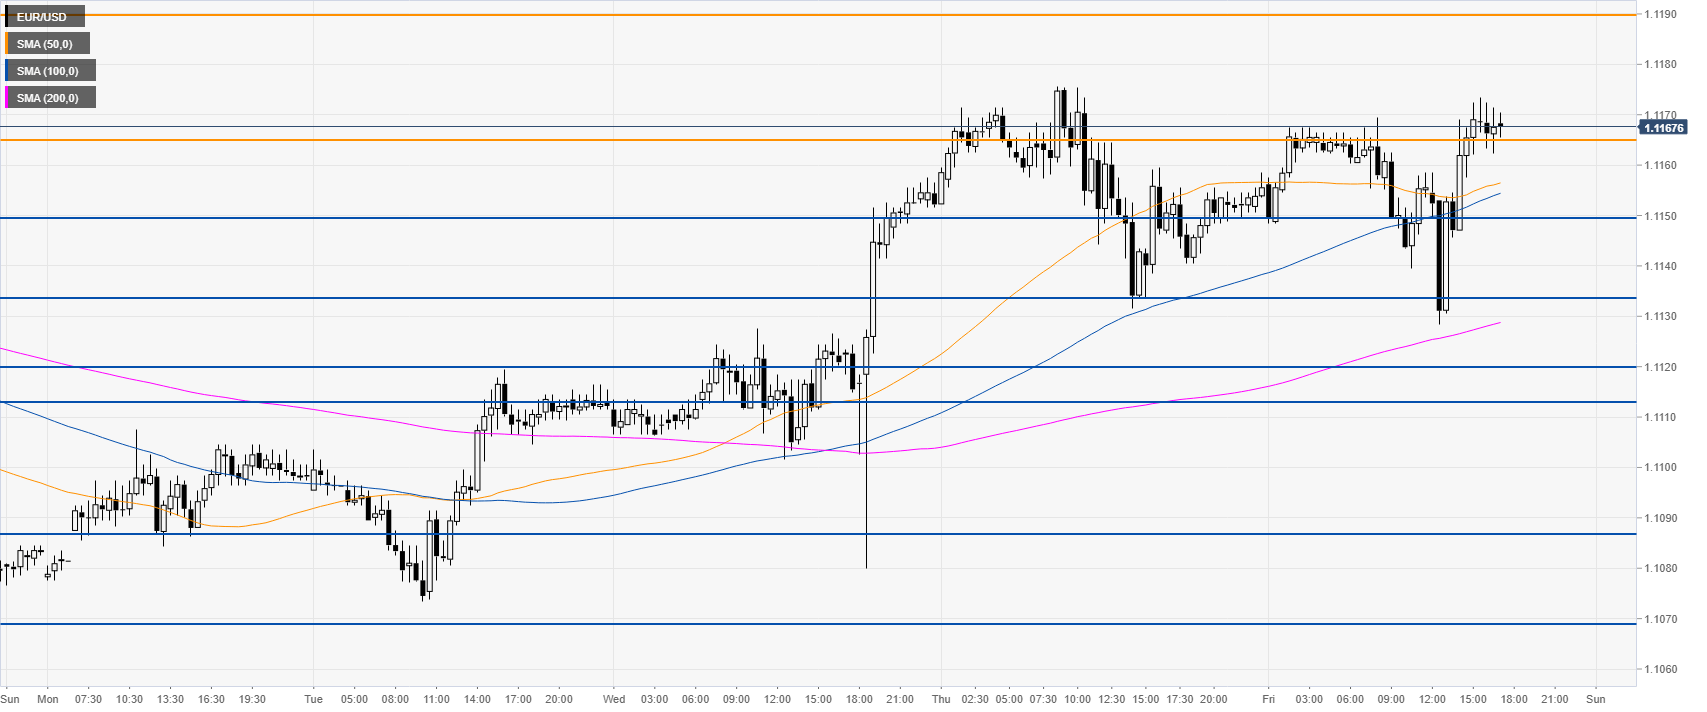
EUR/USD 30-minute chart
EUR/USD is trading above its main SMAs on the 30-minute chart, suggesting a bullish bias in the near term. Support is at the 1.1150, 1.1133 and 1.1113/20 price levels.
Additional key levels