1 Nov 2019
Oil technical analysis: WTI on track to record its largest daily advance since mid-September
- Crude oil is starting November with a massive breakout above $56.00 a barrel.
- Resistance is seen at the 57.00 an 57.50 level on the way up.
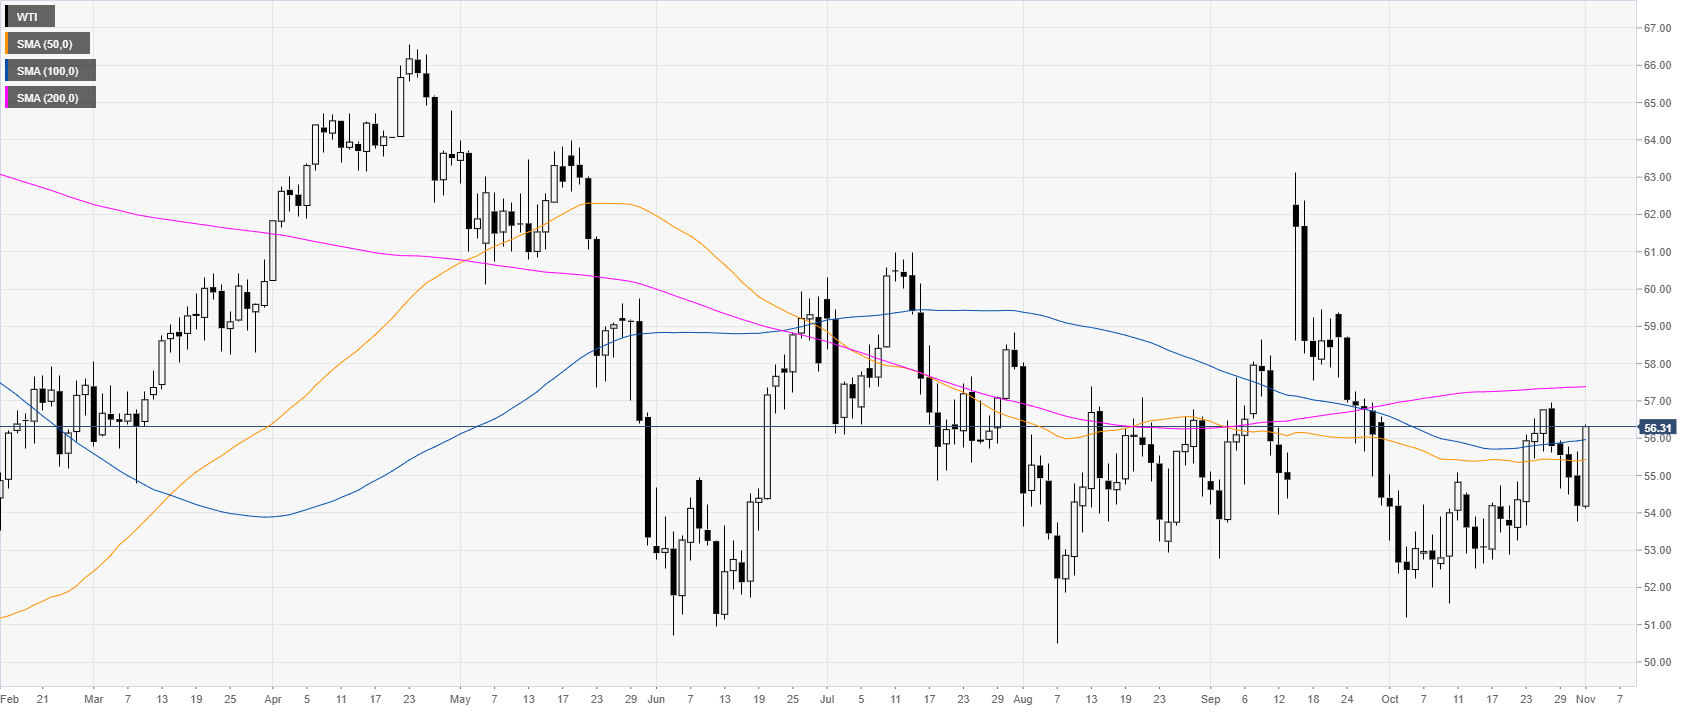
Crude oil daily chart
The crude oil West Texas Intermediate (WTI) is starting November with a huge move to the upside breaking above the $56.00 a barrel and the 50 and 100-day simple moving averages (DMAs).
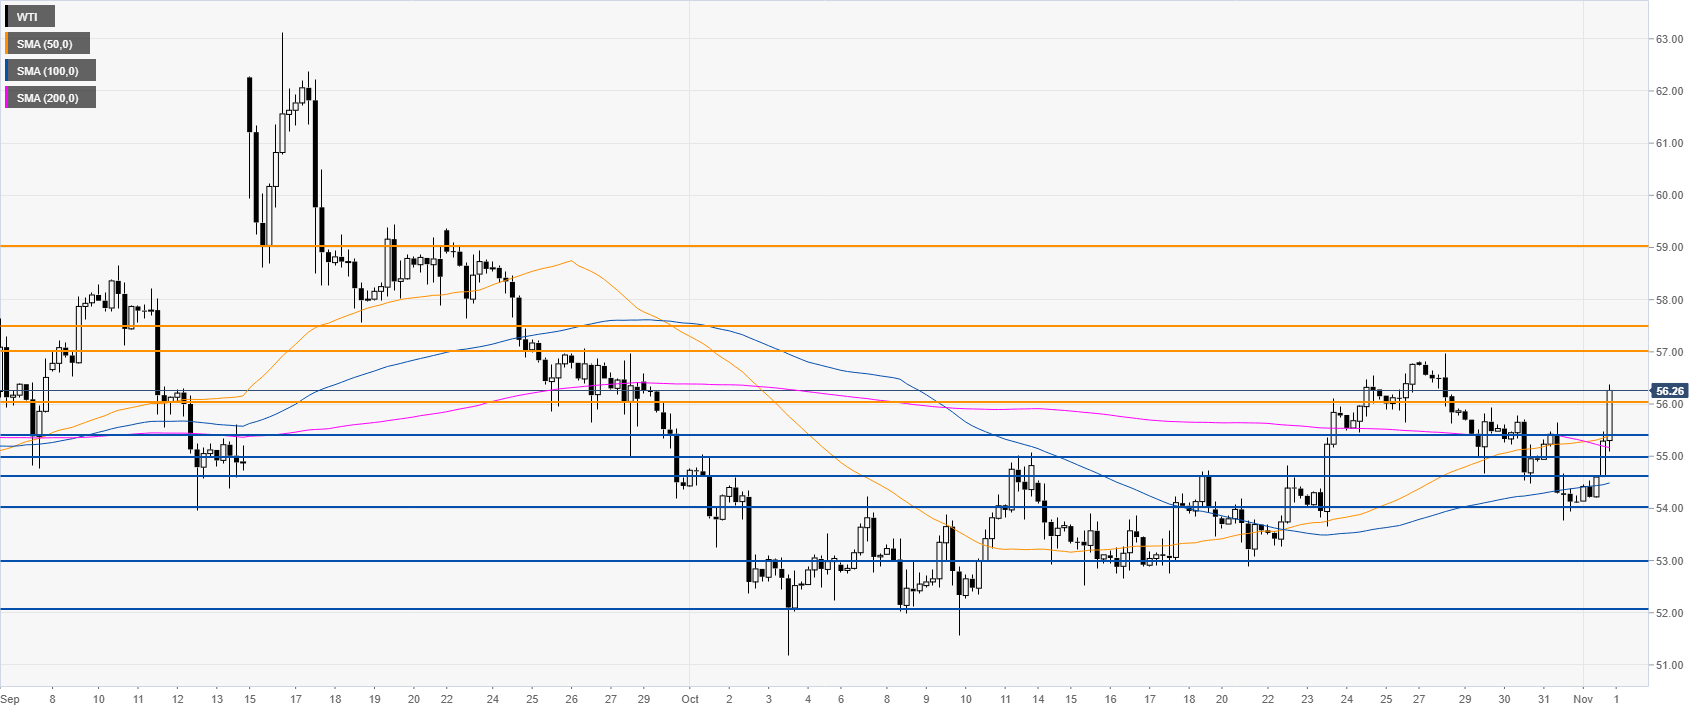
Crude oil four-hour chart
WTI is breaking out to the upside while trading above its main SMAs on the four-hour chart. Buyers seem to have taken the helm and next week 57.00, 57.50 and 59.00 can become the new targets for bulls.
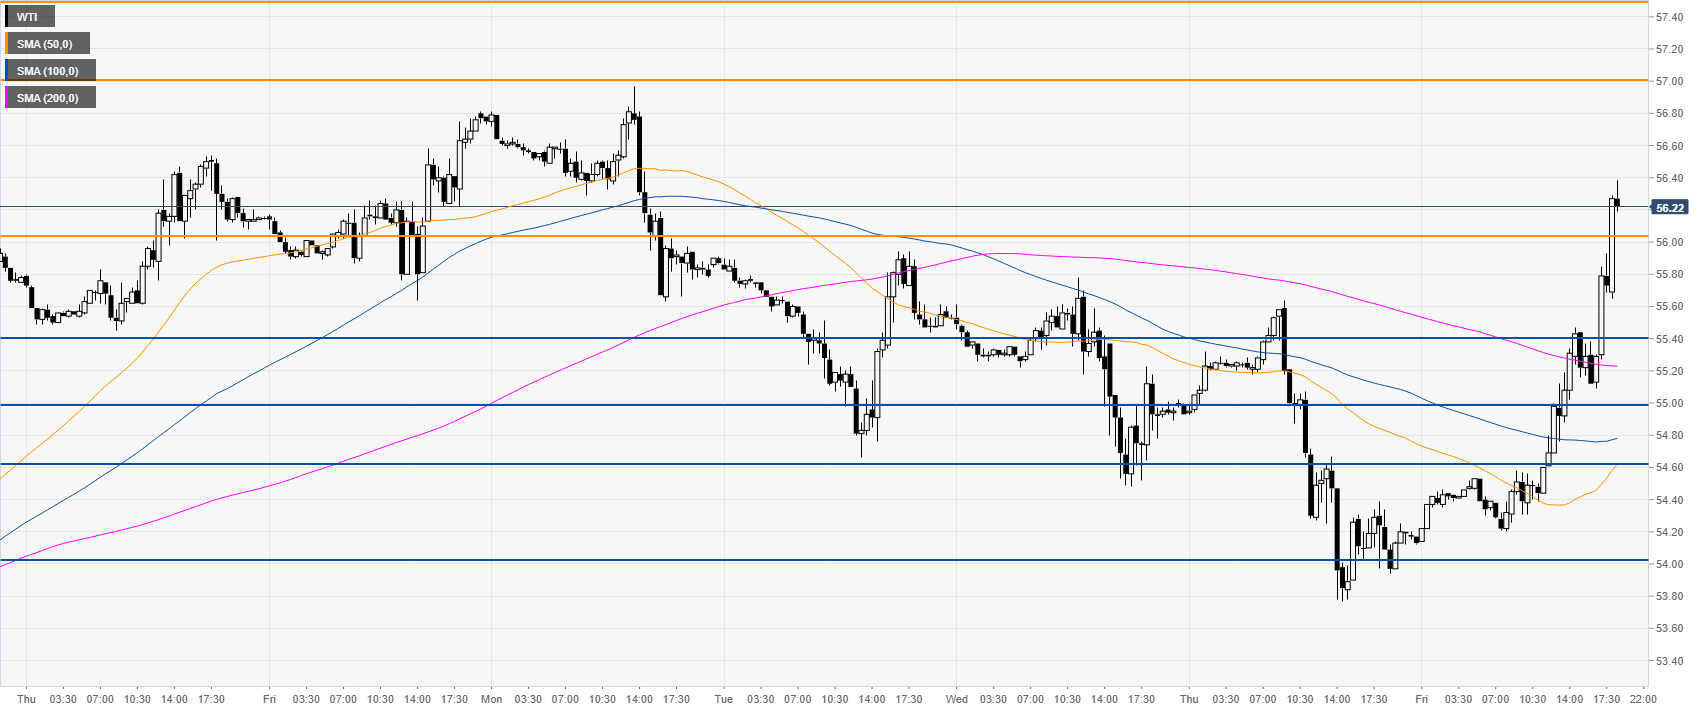
Crude oil 30-minute chart
WTI is trading above its main SMA, suggesting bullish momentum in the near term. Support can be seen at the 56.00 and 55.40 price levels.
Additional key levels