EUR/GBP technical analysis: Struggles between 0.8575 and 21-day SMA
- EUR/GBP bounces off two-week low amid oversold RSI conditions.
- Upside remains capped below 61.8% Fibonacci retracement.
Despite taking a U-turn from the multi-day bottom, EUR/GBP follows the short-term range while heading into the European session on Wednesday. The quote takes the rounds to 0.8595 by the press time.
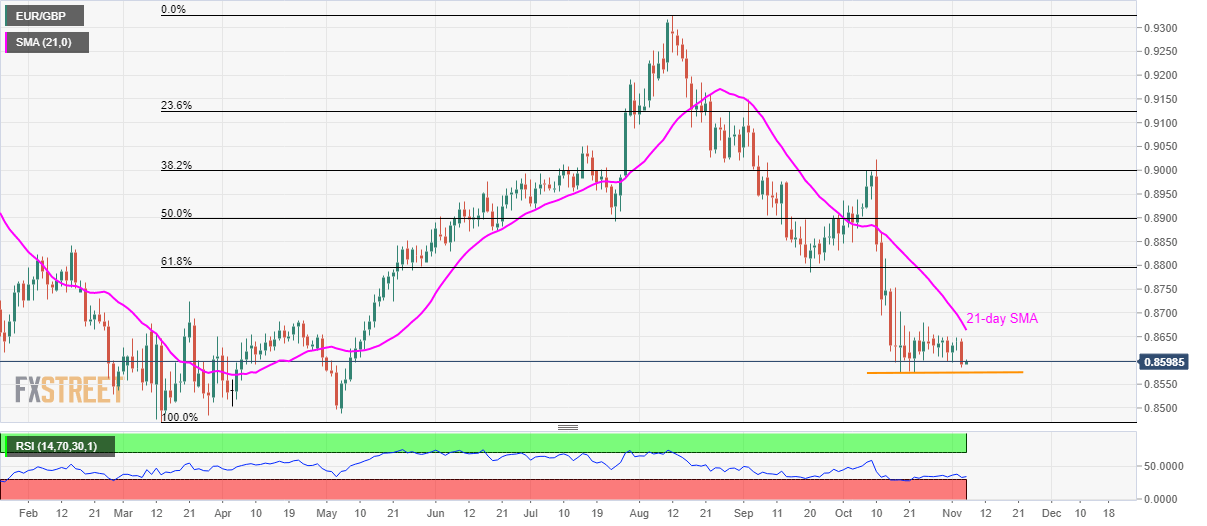
While oversold conditions of 14-bar Relative Strength Index (RSI) favor further recovery, 21-day Simple Moving Average (SMA) level of 0.8664 keeps the rise in check, if not then 0.8700 and 0.8750/55 will question buyers.
It should, however, be noted that bulls can’t be convinced unless prices flash a daily closing beyond 61.8% Fibonacci retracement of March-August upside, at 0.8800.
On the downside, multiple supports around 0.8575 restrict the pair’s immediate declines, ahead of driving it lower to 0.8500 mark.
If at all bears keep the reins past-0.8500, May month low near 0.8490 and March bottom close to 0.8470 could gain market attention.
EUR/GBP daily chart
Trend: sideways