7 Nov 2019
GBP/USD technical analysis: Cable under bearish spell below the 1.2900 handle
- GBP/USD is trading at weekly lows this Thursday.
- The level to beat for bears is the 1.2870 support.
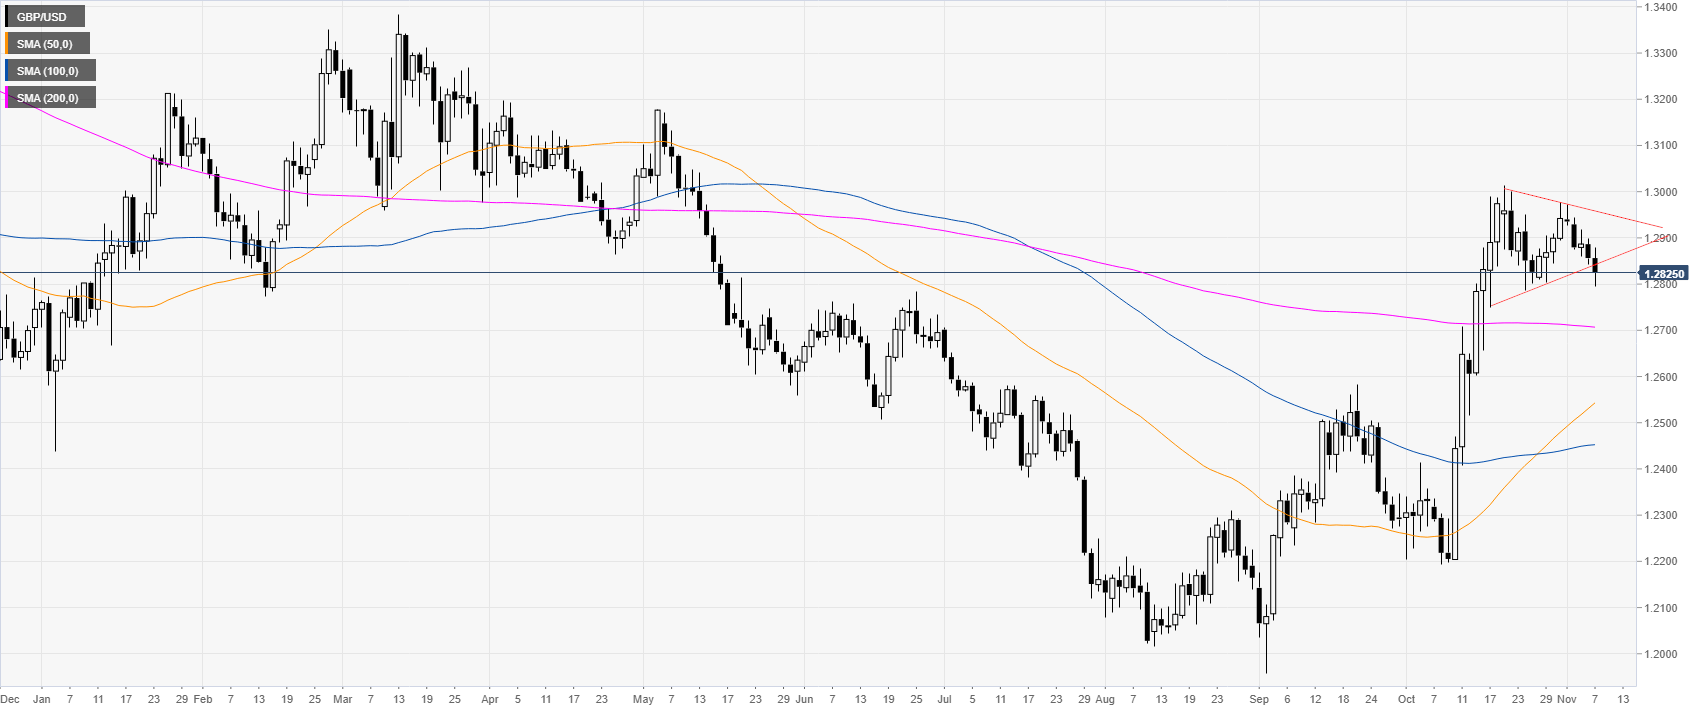
GBP/USD daily chart
In October, the Cable jumped to levels not seen since mid-May 2019. The Cable is trying to break to the downside from a triangle pattern.
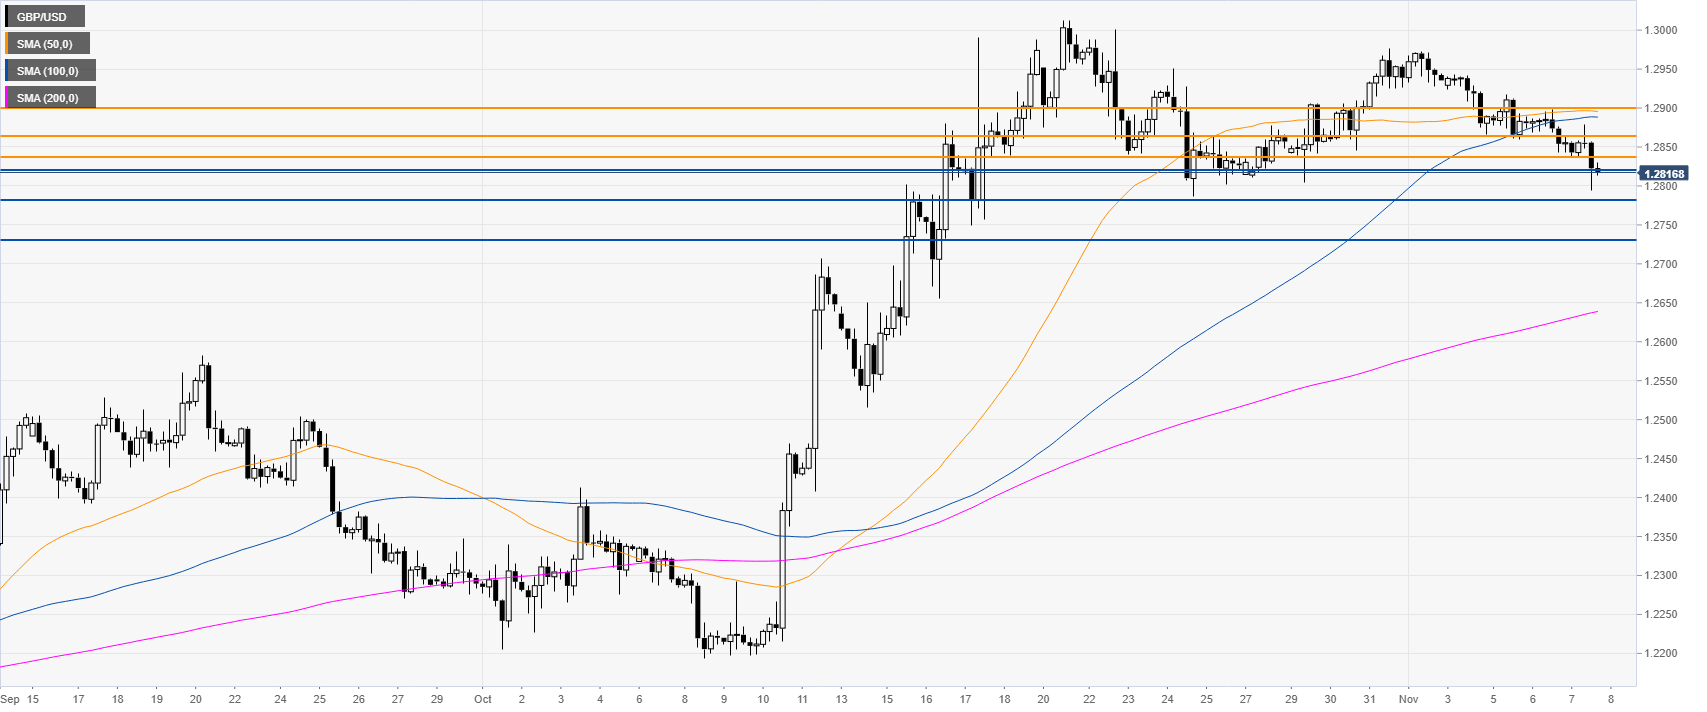
GBP/USD four-hour chart
The market is drifting lower hitting new monthly lows this Thursday while trading below the 50 and 100 SMAs on the four-hour chart.
Sellers will likely be looking for a break below the 1.2821/1.2881 support zone which can lead to further weakness towards the 1.2730 support level, according to the Technical Confluences Indicator.
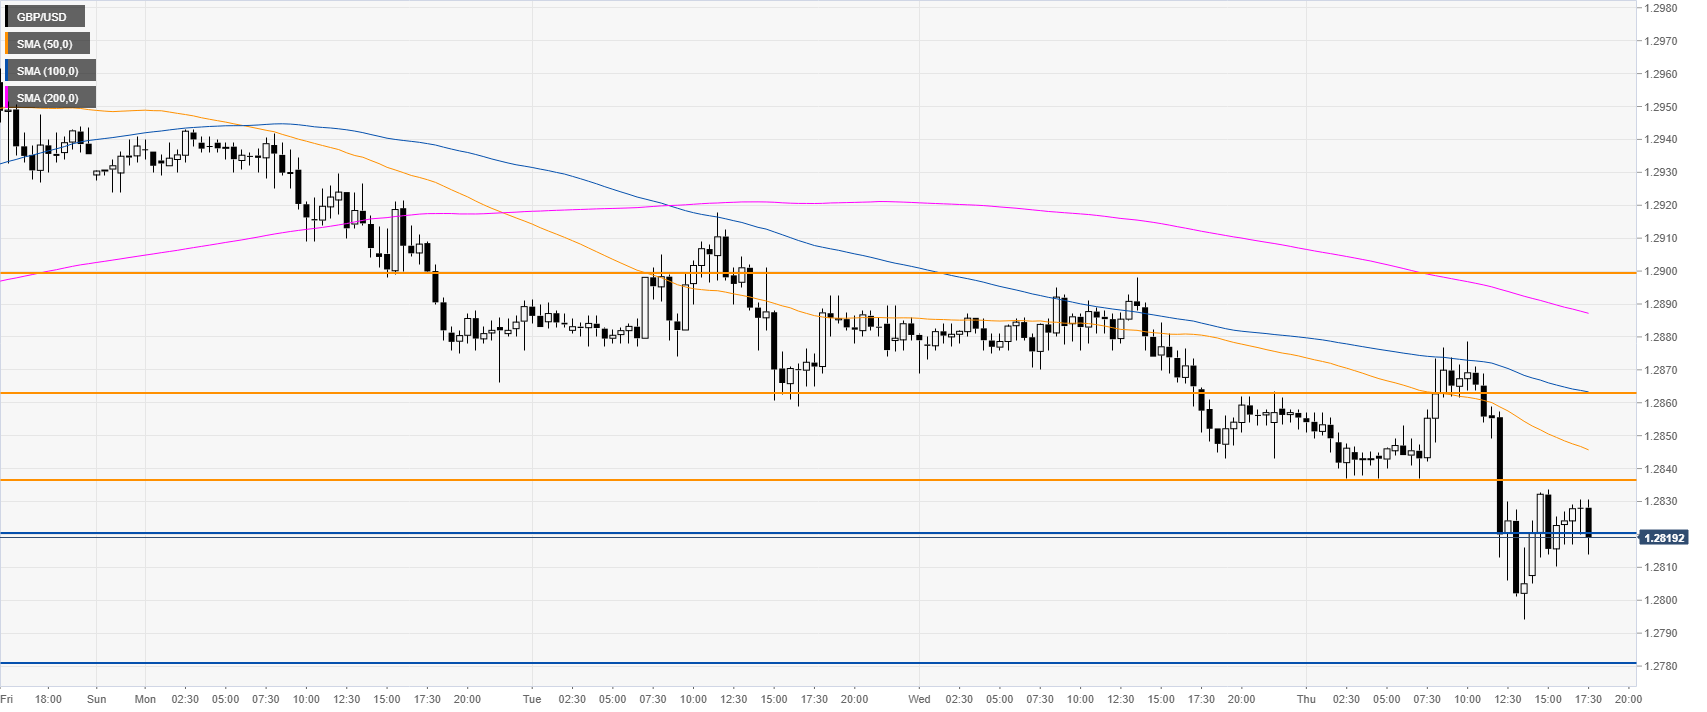
GBP/USD 30-minute chart
Sterling/Dollar is trading below its main SMAs, suggesting a bearish bias in the near term. Immediate resistance is seen at the 1.2835 and the 1.2863 levels, according to the Technical Confluences Indicator.
Additional key levels