11 Nov 2019
Oil technical analysis: WTI sidelined near $57.00 a barrel
- Crude starts the week, keeping the ranging theme unchanged.
- The level to beat for bulls is the 57.50 resistance.
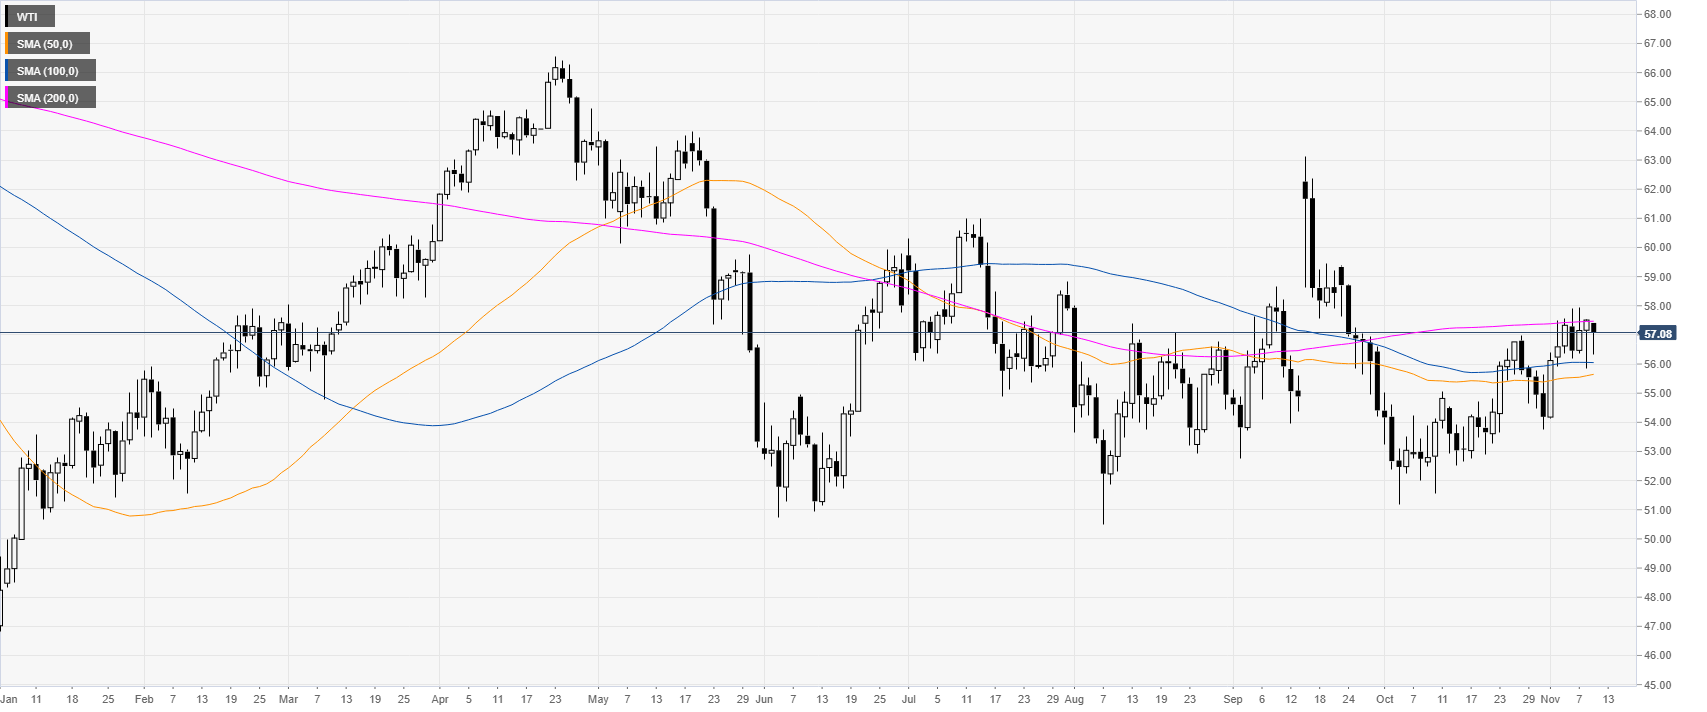
Crude oil daily chart
The crude oil West Texas Intermediate (WTI) is challenging $57.00 a barrel and the 200-day simple moving average (DMA) while the market has been consolidating for the most part of last week.
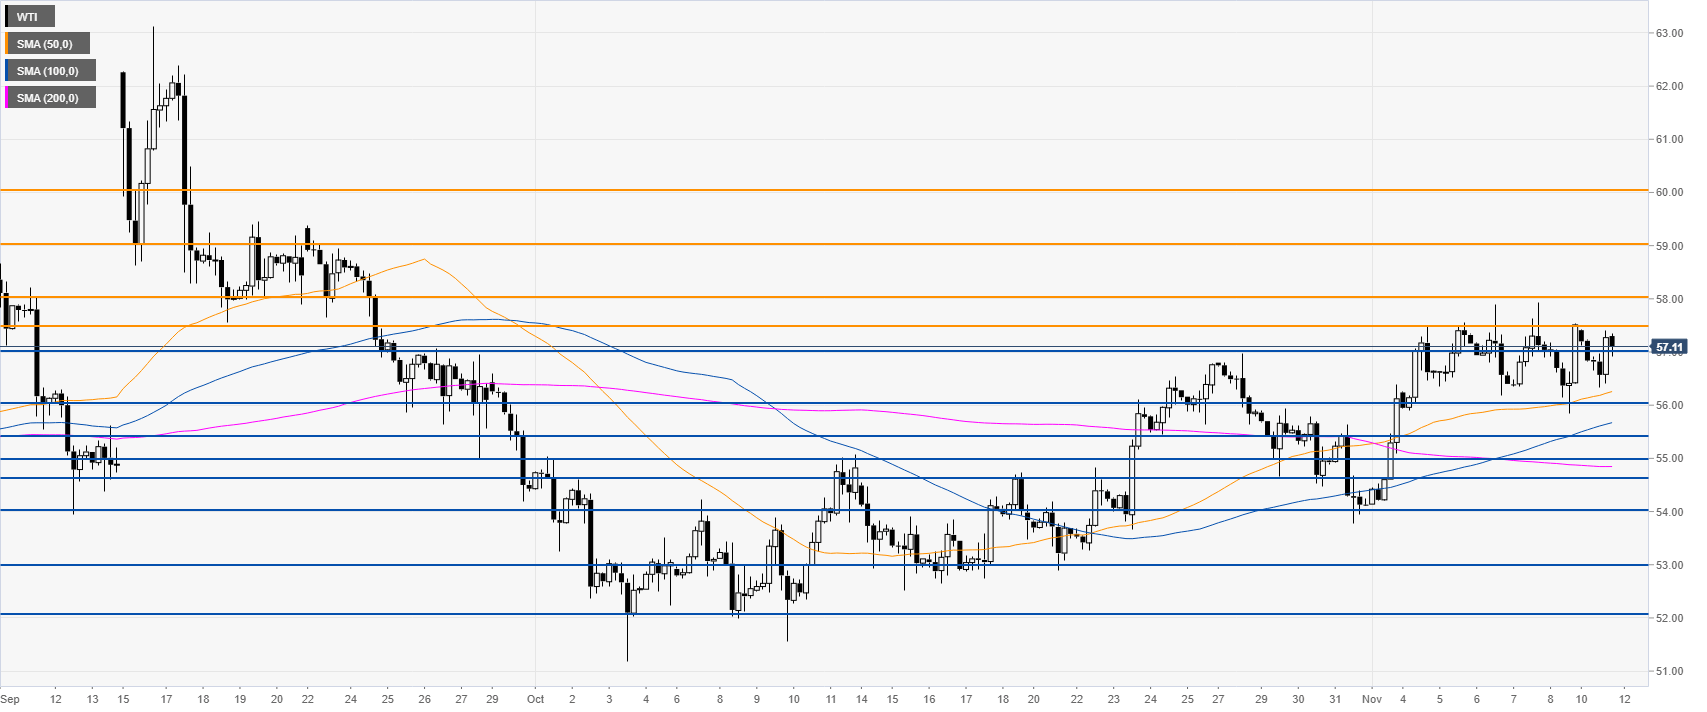
Crude oil four-hour chart
The market is trading above its main SMAs, keeping the bullish bias above the 56.00 support level. Buyers are looking for a daily close above the 57.50 level to potentially resume the bull move towards the 58.00, 59.00 and 60.00 price levels.
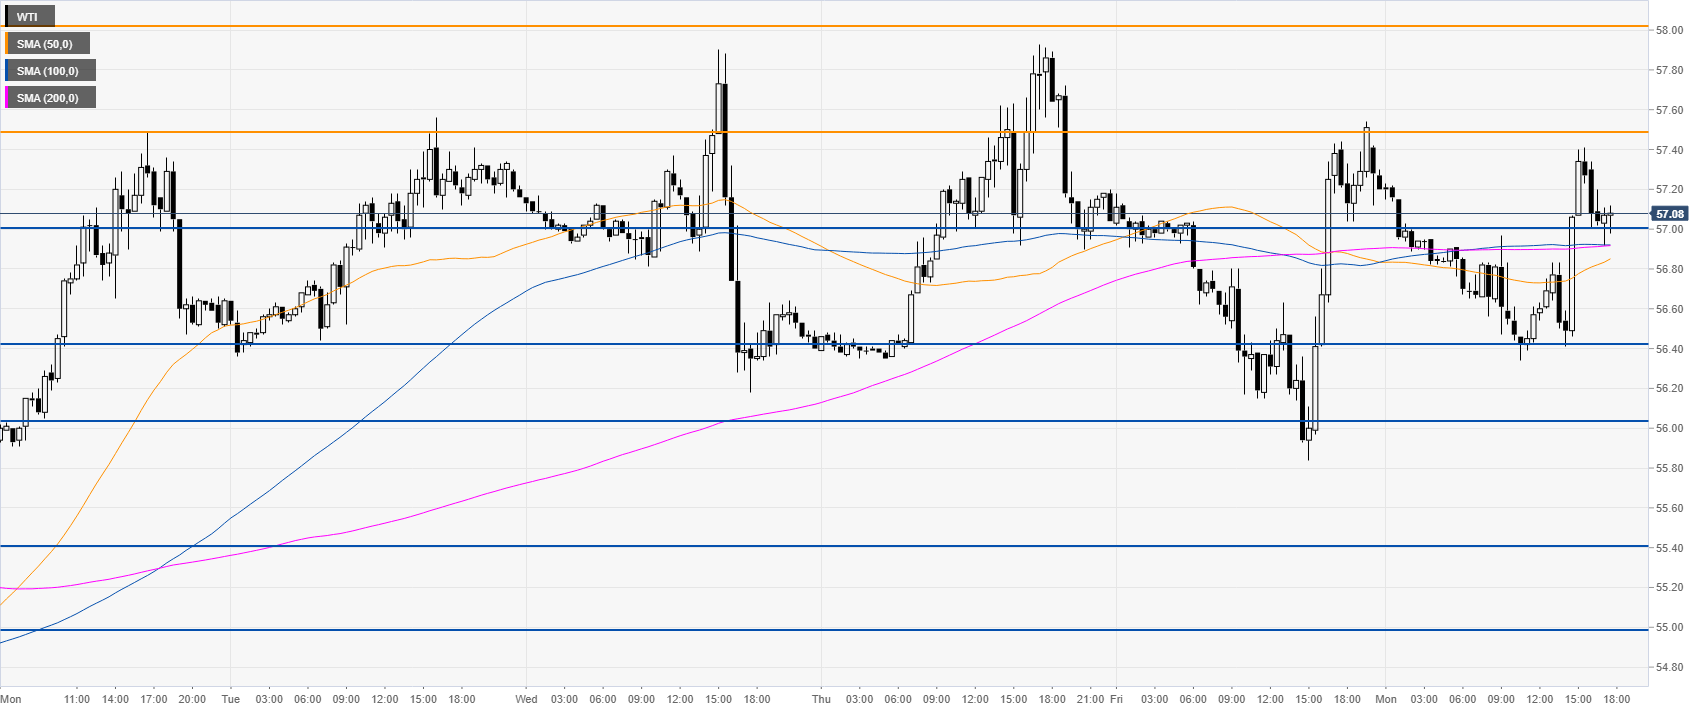
Crude oil 30-minute chart
The range theme remains unchanged at the start of the week. Support is seen at the 57.00 level followed by 56.40 and the 56.00 figure.
Additional key levels