USD/IDR technical analysis: Pulls back from multi-month long trendline, 100-day SMA
- USD/IDR fails to extend recovery gains beyond key resistance-confluence.
- 200-day SMA, 50% Fibonacci retracement adds to the upside barrier.
- July/September lows limit the near-term declines.
The USD/IDR pair’s run-up to the month-start high fails to cross near-term key resistance confluence during early Tuesday. The quote declines to 14,058 by the press time.
Considering the pair’s gradual downward grind, 14,000 and 13,970 are likely immediate supports that sellers can look for ahead of targeting July/September lows near 13,880.
In a case where bears keep dominating below 13,880, June month’s drop to 13,950 can be recalled.
On the contrary, pair’s sustained rise beyond 14,110/20 area including 100-day Simple Moving Average (SMA) and a descending trend line since early August could aim for 14,160/65 confluence that comprising 200-day SMA and 50% Fibonacci retracement of June-August upside.
Should there be a price recovery beyond 14,165, buyers can target October month top near 14,280.
USD/IDR daily chart
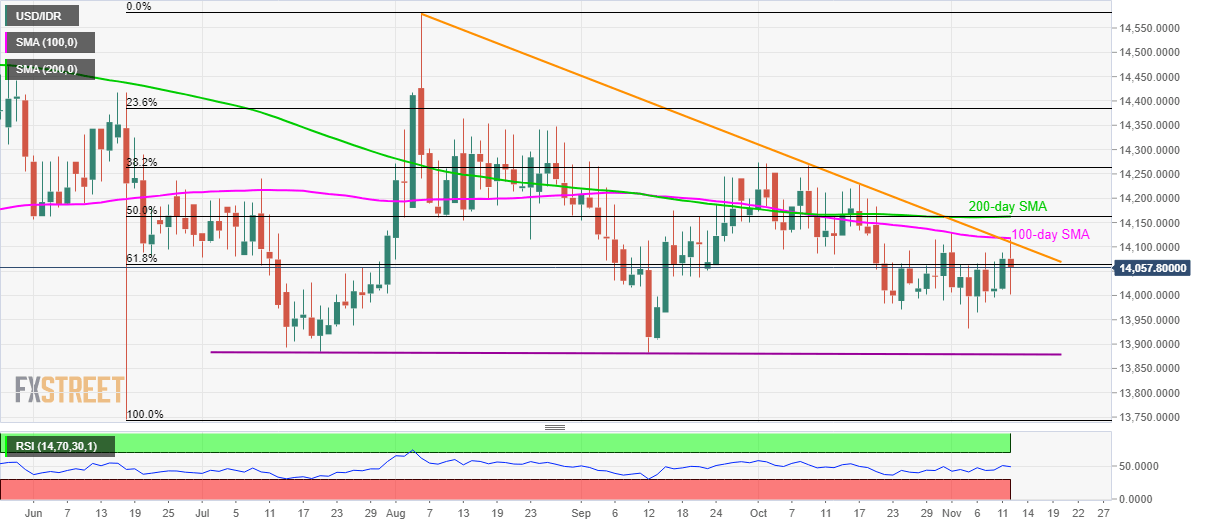
Trend: Bearish