14 Nov 2019
US Dollar Index Technical Analysis: significant resistance emerges around 98.50
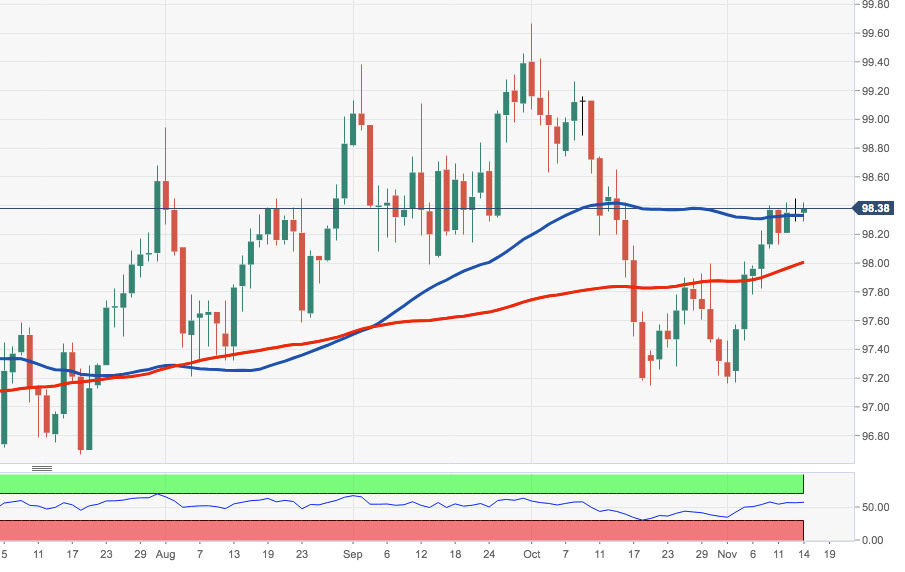
- The index is prolonging the sideline theme in the upper bound of the weekly range, with gains clearly capped by the 98.50 region.
- Further upside is seen testing the 99.00 neighbourhood ahead of 99.25 (October 8th peak).
- On the downside, a sustainable breach of the 55-day SMA in the 98.30 region should open the door for a move to the 100-day SMA at 97.97 ahead of a Fibo retracement of the 2017-2018 drop at 97.87.
DXY daily chart