15 Nov 2019
USD/JPY Technical Analysis: Greenback rebounds from November lows, trading above 108.70 level
- USD/JPY is trading at daily highs into the London close this Friday.
- The level to beat for bulls is the 108.90/109.03 resistance zone.
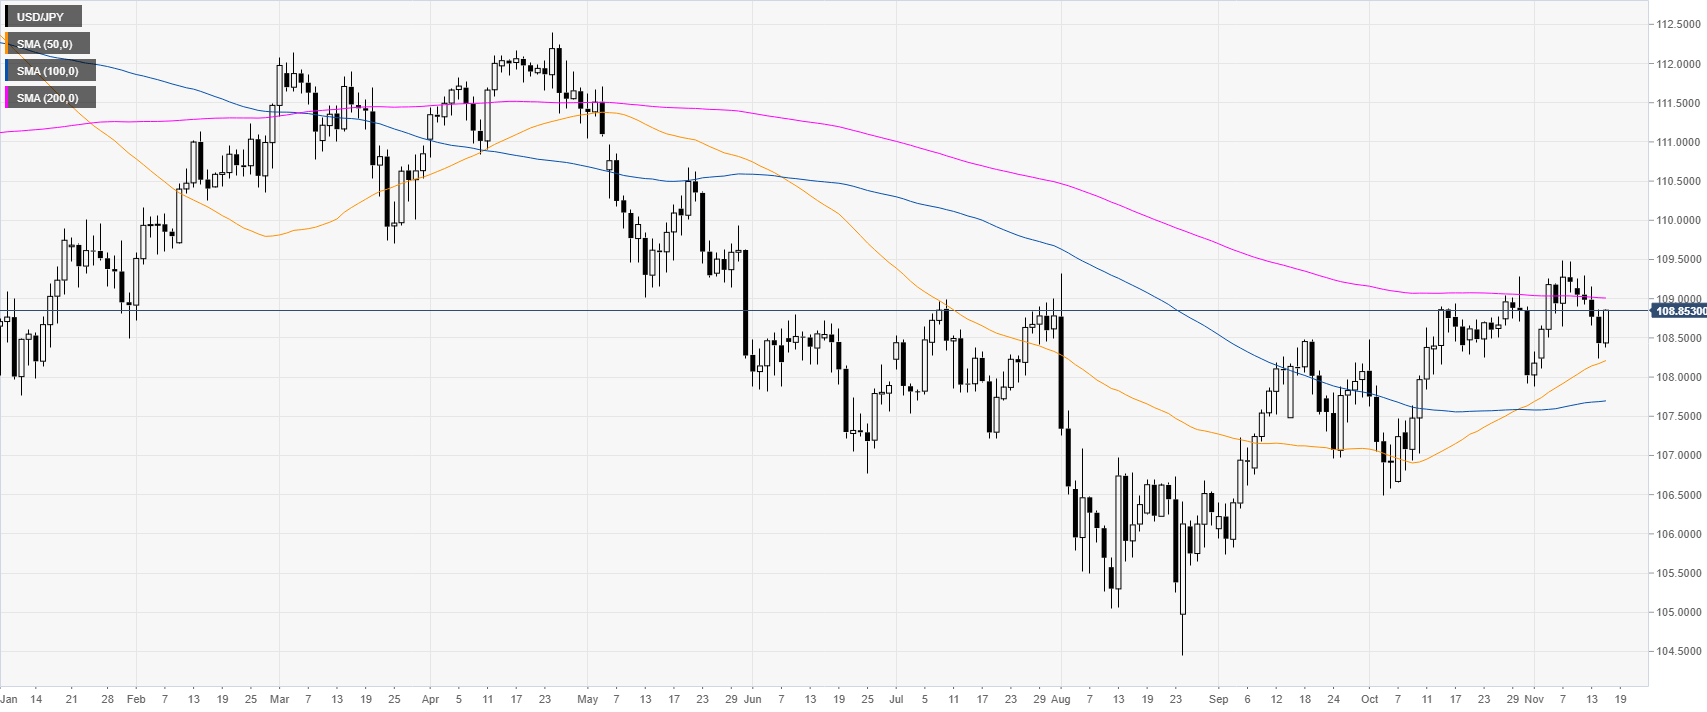
USD/JPY daily chart
USD/JPY is trading just below the 109.00 handle and the 200-day simple moving average (DMA) on the daily time frame. In the last two months, the market has been gaining considerable ground.
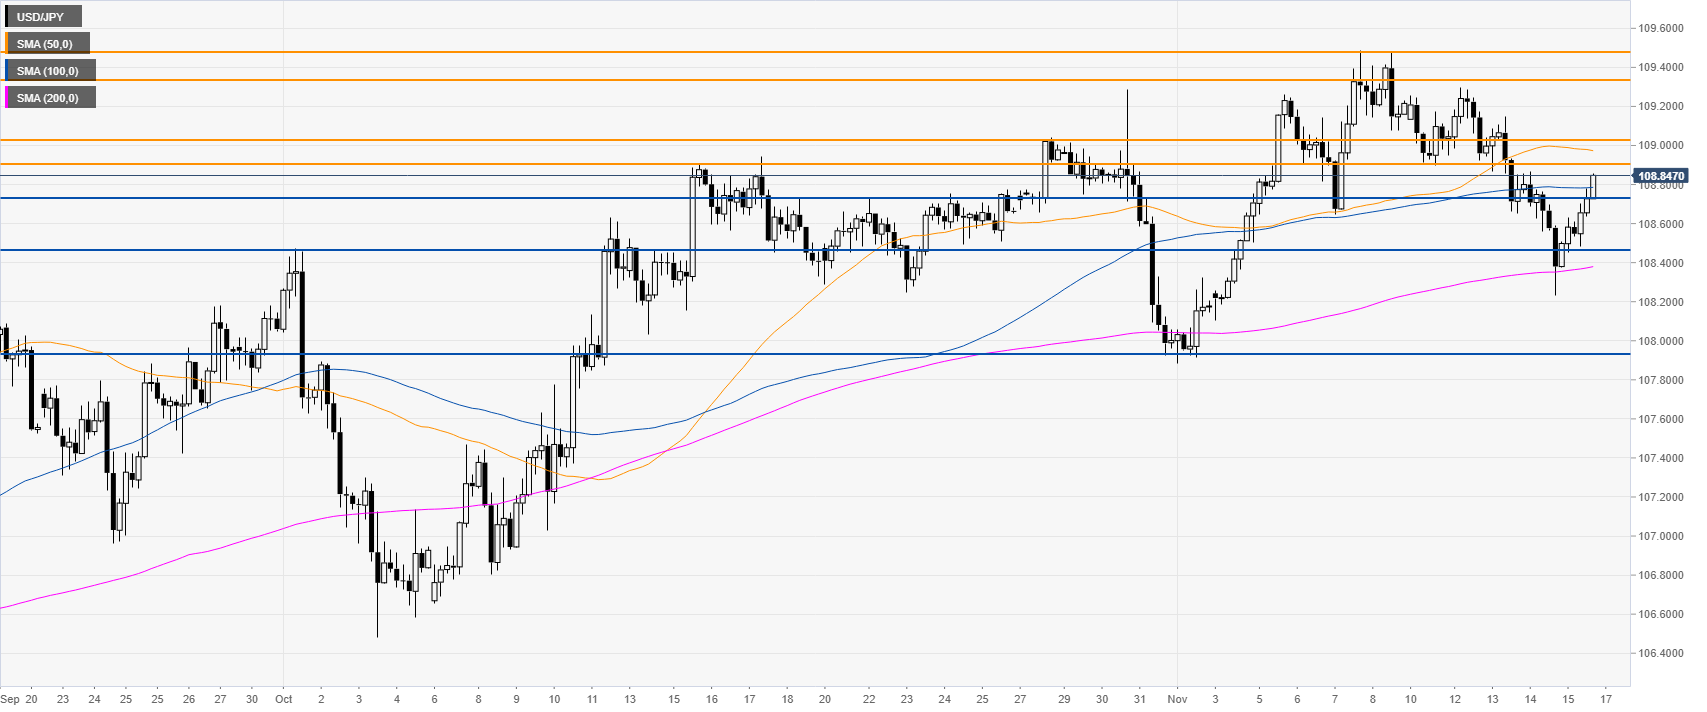
USD/JPY four-hour chart
USD/JPY is rebounding from the November lows while trading above the 100 and 200 SMAs. The market is approaching the 108.90/109.03 resistance zone near the 50 SMA. A break above it can lead to further gains towards the 109.33/109.47 resistance zone.
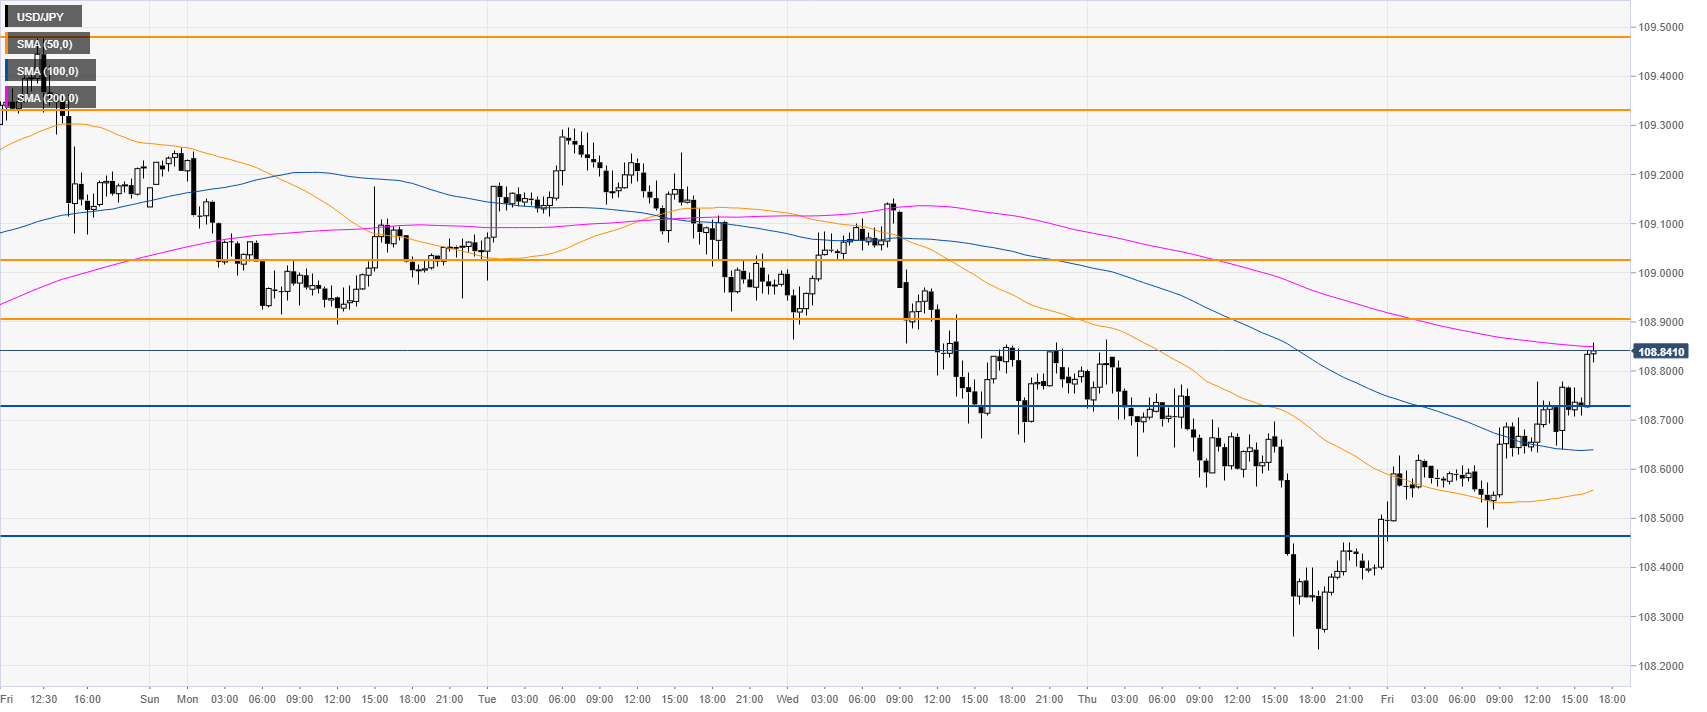
USD/JPY 30-minute chart
USD/JPY is challenging the 200 SMA on the 30-minute chart. Support can be found near the 108.72 and 108.47 levels, according to the Technical Confluences Indicator.
Additional key levels